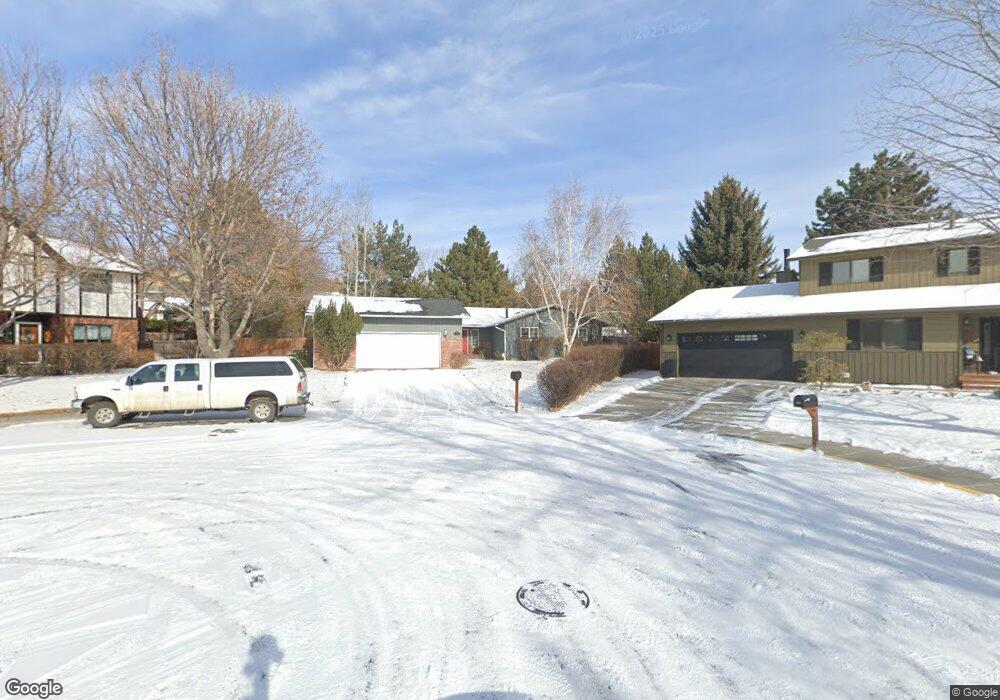
1971 Pryor Ln Billings, MT 59102
North Central Billings NeighborhoodEstimated Value: $518,000 - $619,000
3
Beds
5
Baths
2,438
Sq Ft
$235/Sq Ft
Est. Value
About This Home
This home is located at 1971 Pryor Ln, Billings, MT 59102 and is currently estimated at $574,144, approximately $235 per square foot. 1971 Pryor Ln is a home located in Yellowstone County with nearby schools including Poly Drive School, Lewis & Clark Junior High School, and Billings Senior High School.
Ownership History
Date
Name
Owned For
Owner Type
Purchase Details
Closed on
Sep 9, 2015
Sold by
Ciemins Elizabeth and Leo Michael
Bought by
Ciemins Elizabeth and Leo Michael
Current Estimated Value
Purchase Details
Closed on
Sep 20, 2010
Sold by
Ciemins Elizabeth and Leo Michael
Bought by
Leo Michael and Ciemins Elizabeth
Home Financials for this Owner
Home Financials are based on the most recent Mortgage that was taken out on this home.
Original Mortgage
$293,000
Outstanding Balance
$192,887
Interest Rate
4.38%
Mortgage Type
New Conventional
Estimated Equity
$381,257
Purchase Details
Closed on
Apr 22, 2008
Sold by
Parker Mark D and Taubert Carlene R
Bought by
Elizabeth Ciemins & Michael Leo Living T
Home Financials for this Owner
Home Financials are based on the most recent Mortgage that was taken out on this home.
Original Mortgage
$295,900
Interest Rate
6.11%
Mortgage Type
Purchase Money Mortgage
Create a Home Valuation Report for This Property
The Home Valuation Report is an in-depth analysis detailing your home's value as well as a comparison with similar homes in the area
Home Values in the Area
Average Home Value in this Area
Purchase History
| Date | Buyer | Sale Price | Title Company |
|---|---|---|---|
| Ciemins Elizabeth | -- | None Available | |
| Leo Michael | -- | St | |
| Elizabeth Ciemins & Michael Leo Living T | -- | American Title & Escrow |
Source: Public Records
Mortgage History
| Date | Status | Borrower | Loan Amount |
|---|---|---|---|
| Open | Leo Michael | $293,000 | |
| Closed | Elizabeth Ciemins & Michael Leo Living T | $295,900 |
Source: Public Records
Tax History Compared to Growth
Tax History
| Year | Tax Paid | Tax Assessment Tax Assessment Total Assessment is a certain percentage of the fair market value that is determined by local assessors to be the total taxable value of land and additions on the property. | Land | Improvement |
|---|---|---|---|---|
| 2025 | $5,010 | $613,700 | $67,611 | $546,089 |
| 2024 | $5,010 | $519,700 | $63,956 | $455,744 |
| 2023 | $5,014 | $519,700 | $63,956 | $455,744 |
| 2022 | $4,655 | $424,200 | $0 | $0 |
| 2021 | $4,406 | $424,200 | $0 | $0 |
| 2020 | $4,537 | $419,700 | $0 | $0 |
| 2019 | $4,327 | $419,700 | $0 | $0 |
| 2018 | $4,250 | $404,700 | $0 | $0 |
| 2017 | $3,747 | $404,700 | $0 | $0 |
| 2016 | $3,866 | $383,000 | $0 | $0 |
| 2015 | $3,780 | $383,000 | $0 | $0 |
| 2014 | $3,480 | $187,196 | $0 | $0 |
Source: Public Records
Map
Nearby Homes
- 2030 Rimrock Rd
- 2718 Terrace Dr
- 2042 Green Terrace Dr
- 2510 Terrace Dr
- 1833 Iris Ln
- 2136 Green Terrace Dr
- 9 Stanford Ct
- 2206 Green Terrace Dr
- 2414 Ivy Ln
- 2618 Sunnyview Ln
- 2124 Dahlia Ln
- 3226 Country Club Cir
- 2620 Woody Dr
- 1944 Colton Blvd
- 1734 Mariposa Ln
- 2411 Granite Ave
- 2020 Plaza Dr
- 2910 Glacier Dr
- 3450 Masterson Cir
- 46 Shadow Place Unit 6B
- 1961 Pryor Ln
- 1981 Pryor Ln
- 1980 Mckay Ln
- 2861 Silverwood St
- 2708 Vigilante Trail
- 2704 Vigilante Trail
- 2706 Vigilante Trail
- 1970 Pryor Ln
- 2710 Vigilante Trail
- 1991 Pryor Ln
- 1980 Pryor Ln
- 2871 Silverwood St
- 2780 Vigilante Trail
- 1990 Mckay Ln
- 1990 Pryor Ln
- 2011 Pryor Ln
- 1991 Mckay Ln
- 2714 Hoover Ave
- 2718 Hoover Ave
- 2561 Magnolia Place