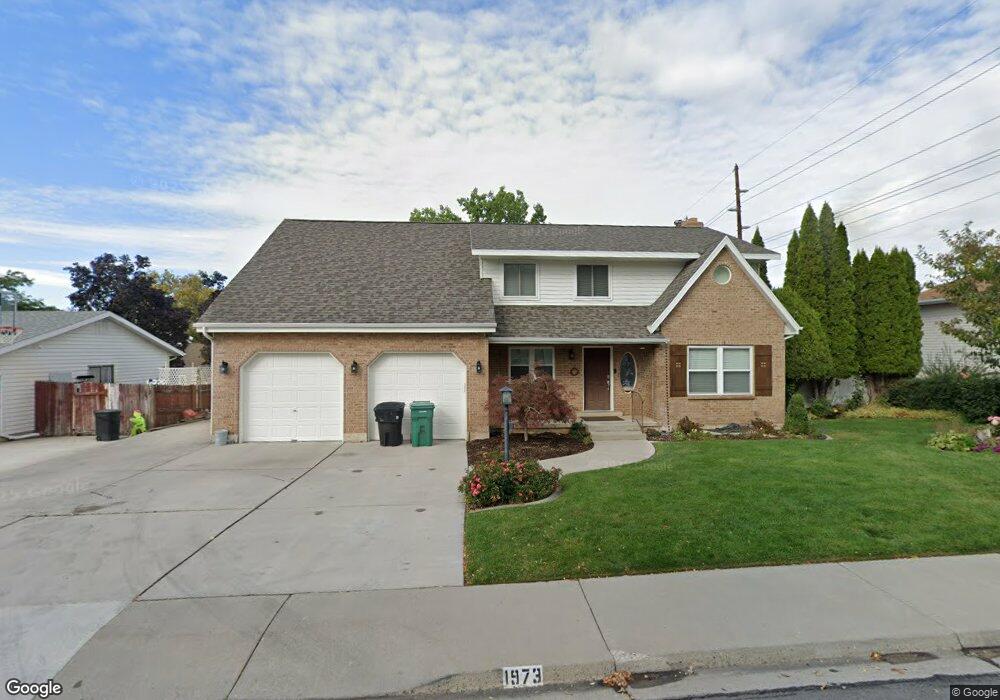
1973 N 270 E Orem, UT 84057
Northridge NeighborhoodEstimated Value: $603,000 - $687,000
6
Beds
3
Baths
3,827
Sq Ft
$171/Sq Ft
Est. Value
About This Home
This home is located at 1973 N 270 E, Orem, UT 84057 and is currently estimated at $653,402, approximately $170 per square foot. 1973 N 270 E is a home located in Utah County with nearby schools including Northridge Elementary School, Oak Canyon Junior High School, and Timpanogos High School.
Ownership History
Date
Name
Owned For
Owner Type
Purchase Details
Closed on
Jul 26, 2001
Sold by
Welch Julie N
Bought by
Welch Julie N
Current Estimated Value
Home Financials for this Owner
Home Financials are based on the most recent Mortgage that was taken out on this home.
Original Mortgage
$40,000
Outstanding Balance
$15,603
Interest Rate
7.15%
Estimated Equity
$637,799
Purchase Details
Closed on
Jul 3, 1998
Sold by
Welch Phillip K and Welch Julie N
Bought by
Welch Julie N
Create a Home Valuation Report for This Property
The Home Valuation Report is an in-depth analysis detailing your home's value as well as a comparison with similar homes in the area
Home Values in the Area
Average Home Value in this Area
Purchase History
| Date | Buyer | Sale Price | Title Company |
|---|---|---|---|
| Welch Julie N | -- | Metro National Title | |
| Welch Julie N | -- | -- |
Source: Public Records
Mortgage History
| Date | Status | Borrower | Loan Amount |
|---|---|---|---|
| Open | Welch Julie N | $40,000 |
Source: Public Records
Tax History
| Year | Tax Paid | Tax Assessment Tax Assessment Total Assessment is a certain percentage of the fair market value that is determined by local assessors to be the total taxable value of land and additions on the property. | Land | Improvement |
|---|---|---|---|---|
| 2025 | $2,641 | $330,110 | -- | -- |
| 2024 | $2,530 | $322,960 | $0 | $0 |
| 2023 | $2,530 | $332,475 | $0 | $0 |
| 2022 | $2,470 | $314,435 | $0 | $0 |
| 2021 | $2,230 | $430,000 | $155,300 | $274,700 |
| 2020 | $2,076 | $393,500 | $124,200 | $269,300 |
| 2019 | $1,818 | $358,400 | $124,200 | $234,200 |
| 2018 | $1,835 | $345,500 | $117,100 | $228,400 |
| 2017 | $1,632 | $164,670 | $0 | $0 |
| 2016 | $1,770 | $164,670 | $0 | $0 |
| 2015 | $1,807 | $159,005 | $0 | $0 |
| 2014 | $1,640 | $143,660 | $0 | $0 |
Source: Public Records
Map
Nearby Homes
Your Personal Tour Guide
Ask me questions while you tour the home.