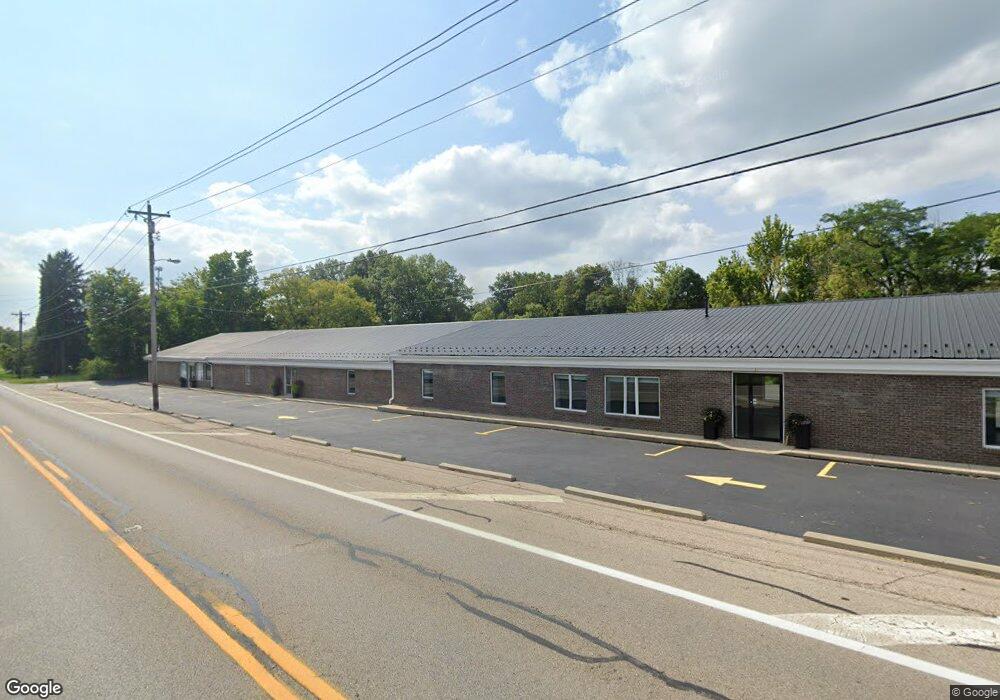
1975 U S 42 Lebanon, OH 45036
Turtlecreek Township NeighborhoodEstimated Value: $563,103
--
Bed
1
Bath
12,478
Sq Ft
$45/Sq Ft
Est. Value
About This Home
This home is located at 1975 U S 42, Lebanon, OH 45036 and is currently estimated at $563,103, approximately $45 per square foot. 1975 U S 42 is a home located in Warren County with nearby schools including Bowman Primary School, Berry Intermediate School, and Donovan Elementary School.
Ownership History
Date
Name
Owned For
Owner Type
Purchase Details
Closed on
Nov 16, 2021
Sold by
Herdman Family Ltd
Bought by
Towne Pest Control Inc
Current Estimated Value
Home Financials for this Owner
Home Financials are based on the most recent Mortgage that was taken out on this home.
Original Mortgage
$352,000
Outstanding Balance
$313,530
Interest Rate
2.99%
Mortgage Type
Commercial
Estimated Equity
$249,573
Purchase Details
Closed on
Dec 14, 2011
Sold by
Summers Jillora H
Bought by
Herdman Family Ltd
Purchase Details
Closed on
Jan 31, 2008
Sold by
Lester Suna Robyn T R and Lester Suna
Bought by
Herdman Family Ltd
Purchase Details
Closed on
Sep 30, 1999
Sold by
Smith Ruth A
Bought by
Southbound Enterprises Ltd
Home Financials for this Owner
Home Financials are based on the most recent Mortgage that was taken out on this home.
Original Mortgage
$504,000
Interest Rate
7.93%
Mortgage Type
New Conventional
Create a Home Valuation Report for This Property
The Home Valuation Report is an in-depth analysis detailing your home's value as well as a comparison with similar homes in the area
Home Values in the Area
Average Home Value in this Area
Purchase History
| Date | Buyer | Sale Price | Title Company |
|---|---|---|---|
| Towne Pest Control Inc | $1,320 | Cesta Joseph A | |
| Herdman Family Ltd | -- | Attorney | |
| Herdman Family Ltd | -- | Attorney | |
| Southbound Enterprises Ltd | $325,000 | -- |
Source: Public Records
Mortgage History
| Date | Status | Borrower | Loan Amount |
|---|---|---|---|
| Open | Towne Pest Control Inc | $352,000 | |
| Previous Owner | Southbound Enterprises Ltd | $504,000 |
Source: Public Records
Tax History Compared to Growth
Tax History
| Year | Tax Paid | Tax Assessment Tax Assessment Total Assessment is a certain percentage of the fair market value that is determined by local assessors to be the total taxable value of land and additions on the property. | Land | Improvement |
|---|---|---|---|---|
| 2024 | $7,772 | $162,360 | $18,450 | $143,910 |
| 2023 | $7,651 | $143,332 | $16,772 | $126,560 |
| 2022 | $7,642 | $143,332 | $16,772 | $126,560 |
| 2021 | $7,193 | $143,332 | $16,772 | $126,560 |
| 2020 | $8,259 | $143,332 | $16,772 | $126,560 |
| 2019 | $8,328 | $143,332 | $16,772 | $126,560 |
| 2018 | $7,668 | $143,332 | $16,772 | $126,560 |
| 2017 | $8,087 | $143,332 | $16,772 | $126,560 |
| 2016 | $8,326 | $143,332 | $16,772 | $126,560 |
| 2015 | $8,341 | $143,332 | $16,772 | $126,560 |
| 2014 | $8,347 | $143,330 | $16,770 | $126,560 |
| 2013 | $8,343 | $143,330 | $16,770 | $126,560 |
Source: Public Records
Map
Nearby Homes
- 73Ac. Walmart Dr
- 2130 N Liberty Keuter Rd
- 2722 N US Route 42
- 2722 U S 42
- 2832 Abby Ln
- 1105 Mockingbird Ln
- 781 Oleander Ct
- 2901 Shoemaker Rd
- 531 Quail Ct
- 532 French Run Ct
- 954 Southline Dr
- 1539 Oregonia Rd
- 19 Hathaway Commons
- 1033 Country Creek Dr
- 202 Charlotte Ave
- 809 Southline Dr
- 355 Summit St
- 2960 Ohio 48
- 465 Creekside Dr
- 7 Hatfield Rd
- 0 Hatfield Rd Unit 1660974
- 0 Hatfield Rd Unit 1660966
- 0 Hatfield Rd
- 1943 N Us Route 42
- 1879 Greenbriar Rd
- 1937 Greenbriar Rd
- 1879 Greenbrier Rd
- 1859 Greenbriar Rd
- 1937 Greenbrier Rd
- 1982 Hatfield Rd
- 1845 Greenbrier Rd
- 1845 Greenbriar Rd
- 1921 N Us Route 42
- 1911 N Us Route 42
- 1911 N State Route 42
- 1823 Greenbriar Rd
- 1953 Greenbrier Rd
- 1911 U S 42
- 2046 N Us Route 42