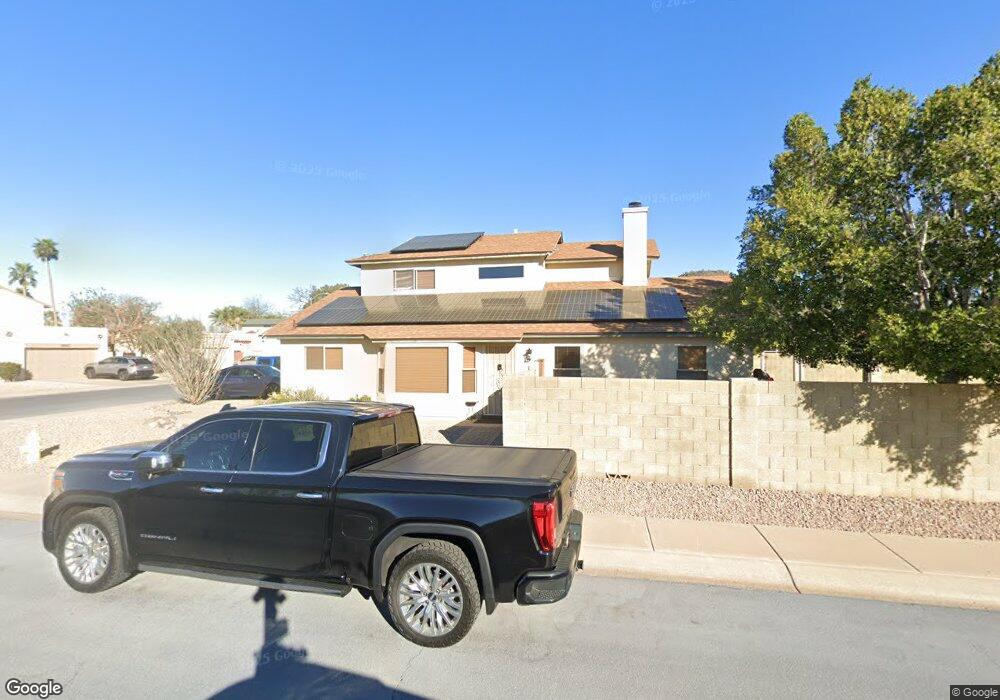
19801 N 47th Ln Glendale, AZ 85308
Deer Valley NeighborhoodEstimated Value: $318,590 - $424,000
--
Bed
2
Baths
1,675
Sq Ft
$230/Sq Ft
Est. Value
About This Home
This home is located at 19801 N 47th Ln, Glendale, AZ 85308 and is currently estimated at $384,898, approximately $229 per square foot. 19801 N 47th Ln is a home located in Maricopa County with nearby schools including Mountain Shadows Elementary School, Desert Sky Middle School, and Deer Valley High School.
Ownership History
Date
Name
Owned For
Owner Type
Purchase Details
Closed on
Feb 22, 2013
Sold by
Jones Sheryl L
Bought by
Jones Sheryl
Current Estimated Value
Home Financials for this Owner
Home Financials are based on the most recent Mortgage that was taken out on this home.
Original Mortgage
$124,100
Outstanding Balance
$86,471
Interest Rate
3.34%
Mortgage Type
New Conventional
Estimated Equity
$298,427
Purchase Details
Closed on
Apr 12, 2010
Sold by
Jones Warren L
Bought by
Jones Sheryl L
Purchase Details
Closed on
Mar 13, 1998
Sold by
Meredith Steven and Meredith Deanne Ann
Bought by
Jones Warren L and Jones Sheryl L
Home Financials for this Owner
Home Financials are based on the most recent Mortgage that was taken out on this home.
Original Mortgage
$99,335
Interest Rate
7.06%
Mortgage Type
FHA
Purchase Details
Closed on
Feb 25, 1997
Sold by
Dressel Thomas E and Dressel Lisa M
Bought by
Meredith Steven and Meredith Deanne Ann
Create a Home Valuation Report for This Property
The Home Valuation Report is an in-depth analysis detailing your home's value as well as a comparison with similar homes in the area
Home Values in the Area
Average Home Value in this Area
Purchase History
| Date | Buyer | Sale Price | Title Company |
|---|---|---|---|
| Jones Sheryl | -- | Driggs Title Agency Inc | |
| Jones Sheryl L | -- | None Available | |
| Jones Warren L | $100,000 | Capital Title Agency | |
| Meredith Steven | $78,998 | Fidelity Title |
Source: Public Records
Mortgage History
| Date | Status | Borrower | Loan Amount |
|---|---|---|---|
| Open | Jones Sheryl | $124,100 | |
| Closed | Jones Warren L | $99,335 |
Source: Public Records
Tax History Compared to Growth
Tax History
| Year | Tax Paid | Tax Assessment Tax Assessment Total Assessment is a certain percentage of the fair market value that is determined by local assessors to be the total taxable value of land and additions on the property. | Land | Improvement |
|---|---|---|---|---|
| 2025 | $1,472 | $14,543 | -- | -- |
| 2024 | $1,449 | $13,850 | -- | -- |
| 2023 | $1,449 | $28,700 | $5,740 | $22,960 |
| 2022 | $1,400 | $22,000 | $4,400 | $17,600 |
| 2021 | $1,438 | $20,020 | $4,000 | $16,020 |
| 2020 | $1,413 | $18,630 | $3,720 | $14,910 |
| 2019 | $1,372 | $17,530 | $3,500 | $14,030 |
| 2018 | $1,329 | $16,130 | $3,220 | $12,910 |
| 2017 | $1,285 | $15,130 | $3,020 | $12,110 |
| 2016 | $1,220 | $14,820 | $2,960 | $11,860 |
| 2015 | $1,093 | $12,880 | $2,570 | $10,310 |
Source: Public Records
Map
Nearby Homes
- 19809 N 47th Ave
- 19813 N 47th Ave
- 4644 W Havasupai Dr
- 4780 W Piute Ave
- 4760 W Wahalla Ln
- 4932 W Oraibi Dr
- 4824 W Kristal Way
- 4725 W Kristal Way
- 4918 W Wahalla Ln Unit 1
- 19814 N 49th Dr
- 20045 N 49th Dr
- 4614 W Kimberly Way
- 4414 W Oraibi Dr
- 4908 W Wescott Dr
- 4743 W Wescott Dr
- 5153 W Pontiac Dr
- 18819 N 49th Ave
- 4426 W Wescott Dr
- 20283 N 51st Dr Unit 8B
- 20003 N 43rd Dr
- 19805 N 47th Ln
- 19809 N 47th Ln
- 19806 N 47th Dr
- 19806 N 47th Dr
- 19810 N 47th Dr
- 19810 N 47th Dr
- 19813 N 47th Ln
- 19814 N 47th Dr
- 19806 N 47th Ln
- 19802 N 47th Ln
- 19810 N 47th Ln
- 19817 N 47th Ln
- 19818 N 47th Dr
- 19814 N 47th Ln
- 19818 N 47th Ln
- 19822 N 47th Dr
- 19821 N 47th Ln
- 19822 N 47th Ln
- 19826 N 47th Dr
- 19826 N 47th Ln