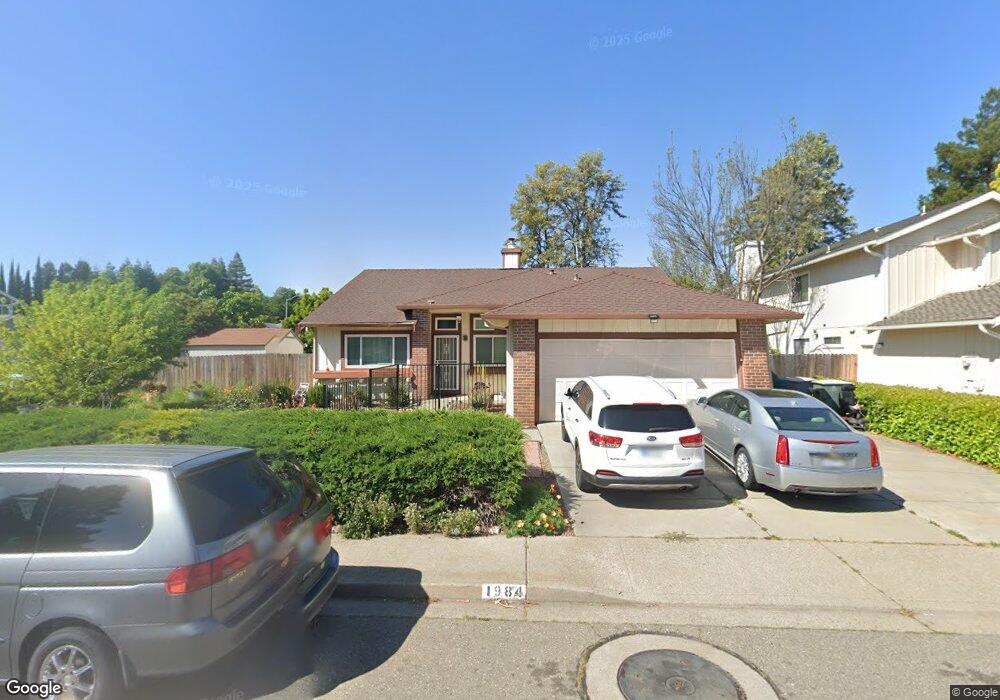
1984 Marshall Rd Vacaville, CA 95687
Estimated Value: $571,000 - $636,000
4
Beds
2
Baths
1,807
Sq Ft
$334/Sq Ft
Est. Value
About This Home
This home is located at 1984 Marshall Rd, Vacaville, CA 95687 and is currently estimated at $602,781, approximately $333 per square foot. 1984 Marshall Rd is a home located in Solano County with nearby schools including Jean Callison Elementary School, Orchard Elementary School, and Vaca Pena Middle School.
Ownership History
Date
Name
Owned For
Owner Type
Purchase Details
Closed on
Mar 20, 2012
Sold by
Wells Fargo Bank Na
Bought by
Lowe Vernon D and Lowe Cynthia D
Current Estimated Value
Home Financials for this Owner
Home Financials are based on the most recent Mortgage that was taken out on this home.
Original Mortgage
$227,250
Outstanding Balance
$156,328
Interest Rate
3.9%
Mortgage Type
Seller Take Back
Estimated Equity
$446,453
Purchase Details
Closed on
Jan 12, 2012
Sold by
Fonseca Jose and Fonseca Ileana
Bought by
Wells Fargo Bank Na
Purchase Details
Closed on
Jun 11, 2002
Sold by
Brodale Genevieve K and Brodale Douglas E
Bought by
Fonseca Jose and Fonseca Ileana
Home Financials for this Owner
Home Financials are based on the most recent Mortgage that was taken out on this home.
Original Mortgage
$248,155
Interest Rate
6.74%
Mortgage Type
FHA
Purchase Details
Closed on
Jun 13, 1994
Sold by
Brodale Genevieve K
Bought by
Brodale Genevieve K and Brodale Douglas E
Create a Home Valuation Report for This Property
The Home Valuation Report is an in-depth analysis detailing your home's value as well as a comparison with similar homes in the area
Purchase History
| Date | Buyer | Sale Price | Title Company |
|---|---|---|---|
| Lowe Vernon D | $220,000 | Fidelity National Title Co | |
| Wells Fargo Bank Na | $187,121 | Accommodation | |
| Fonseca Jose | $286,000 | Fidelity National Title Co | |
| Brodale Genevieve K | -- | -- |
Source: Public Records
Mortgage History
| Date | Status | Borrower | Loan Amount |
|---|---|---|---|
| Open | Lowe Vernon D | $227,250 | |
| Previous Owner | Fonseca Jose | $248,155 |
Source: Public Records
Tax History
| Year | Tax Paid | Tax Assessment Tax Assessment Total Assessment is a certain percentage of the fair market value that is determined by local assessors to be the total taxable value of land and additions on the property. | Land | Improvement |
|---|---|---|---|---|
| 2025 | $1,284 | $276,320 | $87,917 | $188,403 |
| 2024 | $1,284 | $270,903 | $86,194 | $184,709 |
| 2023 | $1,314 | $265,592 | $84,504 | $181,088 |
| 2022 | $1,374 | $260,386 | $82,849 | $177,537 |
| 2021 | $1,368 | $255,281 | $81,225 | $174,056 |
| 2020 | $1,381 | $252,665 | $80,393 | $172,272 |
| 2019 | $3,017 | $247,712 | $78,817 | $168,895 |
| 2018 | $2,983 | $242,856 | $77,272 | $165,584 |
| 2017 | $2,884 | $238,095 | $75,757 | $162,338 |
| 2016 | $2,859 | $233,427 | $74,272 | $159,155 |
| 2015 | $2,823 | $229,922 | $73,157 | $156,765 |
| 2014 | $2,649 | $225,419 | $71,724 | $153,695 |
Source: Public Records
Map
Nearby Homes
- 642 White Oak Ln
- 2099 Marshall Rd
- 106 Kerry Ct
- 1801 Marshall Rd Unit 801
- 1801 Marshall Rd Unit 408
- 107 Cavan Ct
- 112 Melrose Ct
- 912 Cedar Brook Ln
- 113 Richard Place
- 113 Christine Dr
- 2296 Marshall Rd
- 136 Clark Way
- 708 Owl Dr
- 160 Bristol Dr
- 648 Forest Ridge Ln
- 207 Arlington Way
- 124 Dover Way
- 230 Sparrow St
- 462 Eagle Ln
- 875 Christine Dr
- 1990 Marshall Rd
- 400 Inverness Way
- 406 Inverness Way
- 300 Dumbarton Dr
- 306 Dumbarton Dr
- 412 Inverness Way
- 1979 Marshall Rd
- 1985 Marshall Rd
- 1996 Marshall Rd
- 1973 Marshall Rd
- 312 Dumbarton Dr
- 1991 Marshall Rd
- 418 Inverness Way
- 1967 Marshall Rd
- 1960 Marshall Rd
- 2002 Marshall Rd
- 318 Dumbarton Dr
- 424 Inverness Way
- 401 Inverness Way
- 1961 Marshall Rd
Your Personal Tour Guide
Ask me questions while you tour the home.