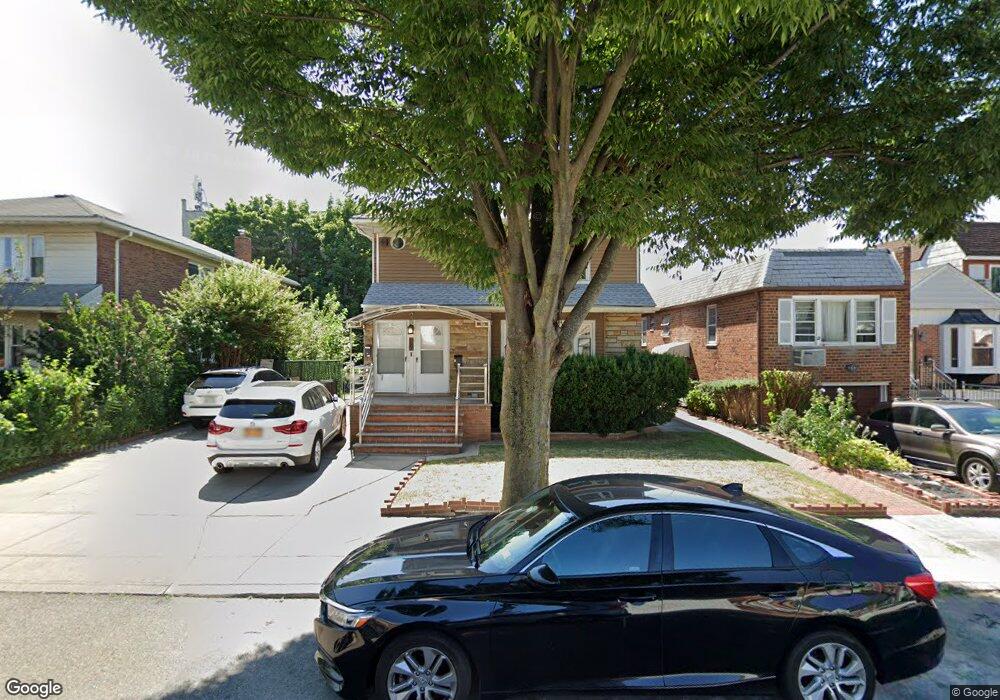
19840 30th Ave Flushing, NY 11358
Auburndale NeighborhoodEstimated Value: $1,297,000 - $1,507,000
3
Beds
1
Bath
1,200
Sq Ft
$1,155/Sq Ft
Est. Value
About This Home
This home is located at 19840 30th Ave, Flushing, NY 11358 and is currently estimated at $1,386,580, approximately $1,155 per square foot. 19840 30th Ave is a home located in Queens County with nearby schools including P.S. 159 Queens, I.S. 25 Adrien Block, and Bayside High School.
Ownership History
Date
Name
Owned For
Owner Type
Purchase Details
Closed on
Jun 10, 2024
Sold by
Li Tang
Bought by
Xu Liang and Zou Yanfen
Current Estimated Value
Home Financials for this Owner
Home Financials are based on the most recent Mortgage that was taken out on this home.
Original Mortgage
$655,000
Outstanding Balance
$645,471
Interest Rate
7.02%
Mortgage Type
Purchase Money Mortgage
Estimated Equity
$741,109
Purchase Details
Closed on
May 7, 2014
Sold by
Kim Samuel Won Min
Bought by
Li Tang
Home Financials for this Owner
Home Financials are based on the most recent Mortgage that was taken out on this home.
Original Mortgage
$750,000
Interest Rate
4.29%
Purchase Details
Closed on
Aug 4, 2011
Sold by
Lowe Edith
Bought by
Kim Samuel Won Min
Home Financials for this Owner
Home Financials are based on the most recent Mortgage that was taken out on this home.
Original Mortgage
$580,000
Interest Rate
4.52%
Mortgage Type
Commercial
Create a Home Valuation Report for This Property
The Home Valuation Report is an in-depth analysis detailing your home's value as well as a comparison with similar homes in the area
Home Values in the Area
Average Home Value in this Area
Purchase History
| Date | Buyer | Sale Price | Title Company |
|---|---|---|---|
| Xu Liang | $1,300,000 | -- | |
| Xu Liang | $1,300,000 | -- | |
| Li Tang | $949,500 | -- | |
| Kim Samuel Won Min | $730,000 | -- | |
| Kim Samuel Won Min | $730,000 | -- |
Source: Public Records
Mortgage History
| Date | Status | Borrower | Loan Amount |
|---|---|---|---|
| Open | Xu Liang | $655,000 | |
| Closed | Xu Liang | $655,000 | |
| Previous Owner | Li Tang | $750,000 | |
| Previous Owner | Kim Samuel Won Min | $580,000 |
Source: Public Records
Tax History
| Year | Tax Paid | Tax Assessment Tax Assessment Total Assessment is a certain percentage of the fair market value that is determined by local assessors to be the total taxable value of land and additions on the property. | Land | Improvement |
|---|---|---|---|---|
| 2025 | $10,395 | $54,859 | $14,676 | $40,183 |
| 2024 | $10,395 | $51,756 | $13,008 | $38,748 |
| 2023 | $10,395 | $51,756 | $14,301 | $37,455 |
| 2022 | $10,254 | $86,220 | $22,680 | $63,540 |
| 2021 | $10,198 | $71,460 | $22,680 | $48,780 |
| 2020 | $9,677 | $78,540 | $22,680 | $55,860 |
| 2019 | $9,022 | $84,720 | $22,680 | $62,040 |
| 2018 | $8,792 | $43,130 | $14,140 | $28,990 |
| 2017 | $8,726 | $42,804 | $14,926 | $27,878 |
| 2016 | $8,073 | $42,804 | $14,926 | $27,878 |
| 2015 | $4,870 | $38,097 | $13,058 | $25,039 |
| 2014 | $4,870 | $35,942 | $13,875 | $22,067 |
Source: Public Records
Map
Nearby Homes
- 198-40-198-30 30th Ave
- 198-40-198-30 30th Ave
- 19840 30th Ave
- 19838 30th Ave
- 19836 30th Ave
- 19846 30th Ave
- 19834 30th Ave
- 19832 30th Ave
- 19833 32nd Ave
- 19833 32nd Ave Unit 1 Fl
- 19833 32nd Ave
- 19830 30th Ave
- 29-20 Jordan St
- 19833 32nd Ave
- 19839 32nd Ave
- 2920 Jordan St
- 19831 32nd Ave
- 19829 32nd Ave
- 19828 30th Ave
- 2918 Jordan St
Your Personal Tour Guide
Ask me questions while you tour the home.