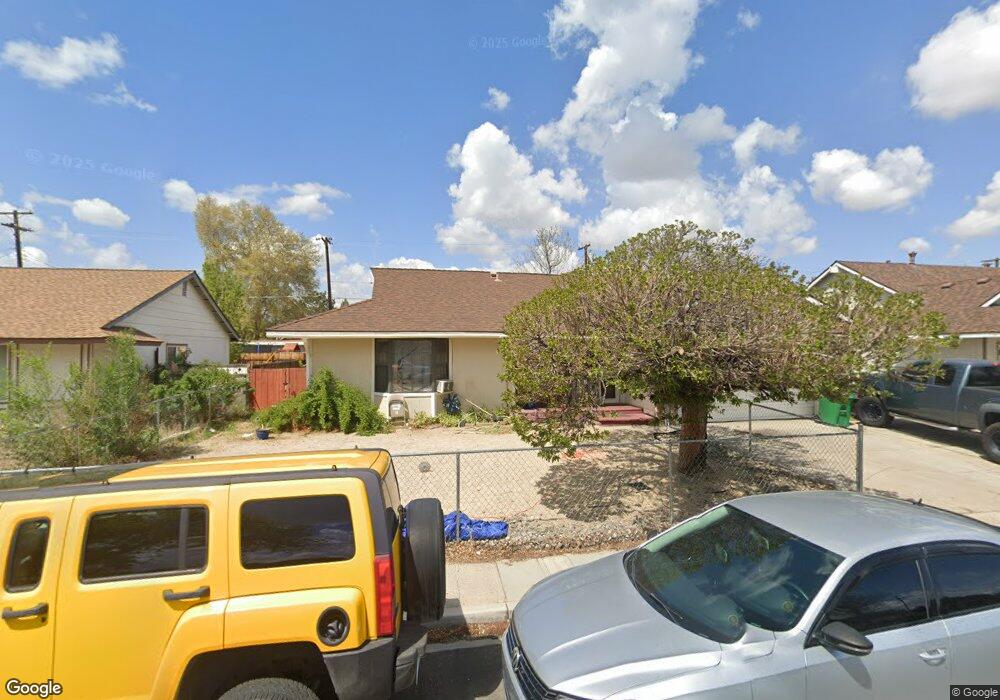
1985 Rock Blvd Unit 3 Sparks, NV 89431
North Rock NeighborhoodEstimated Value: $335,000 - $478,000
3
Beds
3
Baths
1,845
Sq Ft
$232/Sq Ft
Est. Value
About This Home
This home is located at 1985 Rock Blvd Unit 3, Sparks, NV 89431 and is currently estimated at $427,874, approximately $231 per square foot. 1985 Rock Blvd Unit 3 is a home located in Washoe County with nearby schools including Agnes Risley Elementary School, Sparks Middle School, and Sparks High School.
Ownership History
Date
Name
Owned For
Owner Type
Purchase Details
Closed on
Apr 6, 2011
Sold by
Beneficial Financial I Inc
Bought by
Godin Gene
Current Estimated Value
Home Financials for this Owner
Home Financials are based on the most recent Mortgage that was taken out on this home.
Original Mortgage
$71,120
Outstanding Balance
$48,998
Interest Rate
4.77%
Mortgage Type
New Conventional
Estimated Equity
$378,876
Purchase Details
Closed on
Dec 13, 2010
Sold by
Gonzalez Arturo Diaz and Diaz Tracy L
Bought by
Beneficial Financial I Inc
Purchase Details
Closed on
May 18, 2001
Sold by
Lotts William Scott and Lotts Margaret C
Bought by
Gonzalez Arturo Diaz and Diaz Tracy L
Home Financials for this Owner
Home Financials are based on the most recent Mortgage that was taken out on this home.
Original Mortgage
$137,643
Interest Rate
7.03%
Create a Home Valuation Report for This Property
The Home Valuation Report is an in-depth analysis detailing your home's value as well as a comparison with similar homes in the area
Home Values in the Area
Average Home Value in this Area
Purchase History
| Date | Buyer | Sale Price | Title Company |
|---|---|---|---|
| Godin Gene | $89,000 | Ticor Title | |
| Beneficial Financial I Inc | $101,290 | None Available | |
| Beneficial Financial I Inc | $101,290 | Lsi Title Agency Inc | |
| Beneficial Financial I Inc | $101,290 | None Available | |
| Gonzalez Arturo Diaz | $142,000 | First Centennial Title Co |
Source: Public Records
Mortgage History
| Date | Status | Borrower | Loan Amount |
|---|---|---|---|
| Open | Godin Gene | $71,120 | |
| Previous Owner | Gonzalez Arturo Diaz | $137,643 |
Source: Public Records
Tax History Compared to Growth
Tax History
| Year | Tax Paid | Tax Assessment Tax Assessment Total Assessment is a certain percentage of the fair market value that is determined by local assessors to be the total taxable value of land and additions on the property. | Land | Improvement |
|---|---|---|---|---|
| 2025 | $1,249 | $57,307 | $31,343 | $25,964 |
| 2024 | $1,249 | $52,750 | $27,185 | $25,565 |
| 2023 | $1,212 | $52,286 | $28,602 | $23,684 |
| 2022 | $1,178 | $43,751 | $24,444 | $19,307 |
| 2021 | $1,143 | $35,218 | $16,412 | $18,806 |
| 2020 | $1,108 | $34,516 | $16,065 | $18,451 |
| 2019 | $1,057 | $33,307 | $15,845 | $17,462 |
| 2018 | $1,009 | $28,809 | $11,120 | $17,689 |
| 2017 | $962 | $28,392 | $10,112 | $18,280 |
| 2016 | $937 | $28,037 | $8,789 | $19,248 |
Source: Public Records
Map
Nearby Homes
- 2154 Oppio St
- 1124 Sbragia Way
- 1655 Byrd Dr
- 1595 York Way
- 1365 Prospect Ave
- 1121 Greenbrae Dr
- 1110 Xman Way
- 1160 York Way
- 1780 Greenbrae Dr
- 1003 Sbragia Way
- 1799 Vance Way
- 1345 Plymouth Way
- 1705 9th St
- 1125 Dodson Way
- 1855 Verano Dr
- 1560 Steven Ct Unit 2
- 1527 Steven Ct
- 1536 Irene Way
- 1731 Gault Way Unit D
- 0 N Mccarran Blvd Unit 250052909
- 1955 Rock Blvd
- 2005 Rock Blvd
- 1980 Oppio St
- 2000 Oppio St
- 1950 Oppio St
- 2055 Rock Blvd Unit 3
- 1510 Tyler Way
- 1530 Tyler Way
- 2050 Oppio St
- 1465 Upton Way
- 1540 Tyler Way
- 1460 Upton Way
- 2095 Rock Blvd
- 1460 Tyler Way
- 2090 Oppio St
- 1445 Upton Way
- 1985 Oppio St Unit 1
- 1985 Oppio St
- 1440 Upton Way
- 1955 Oppio St