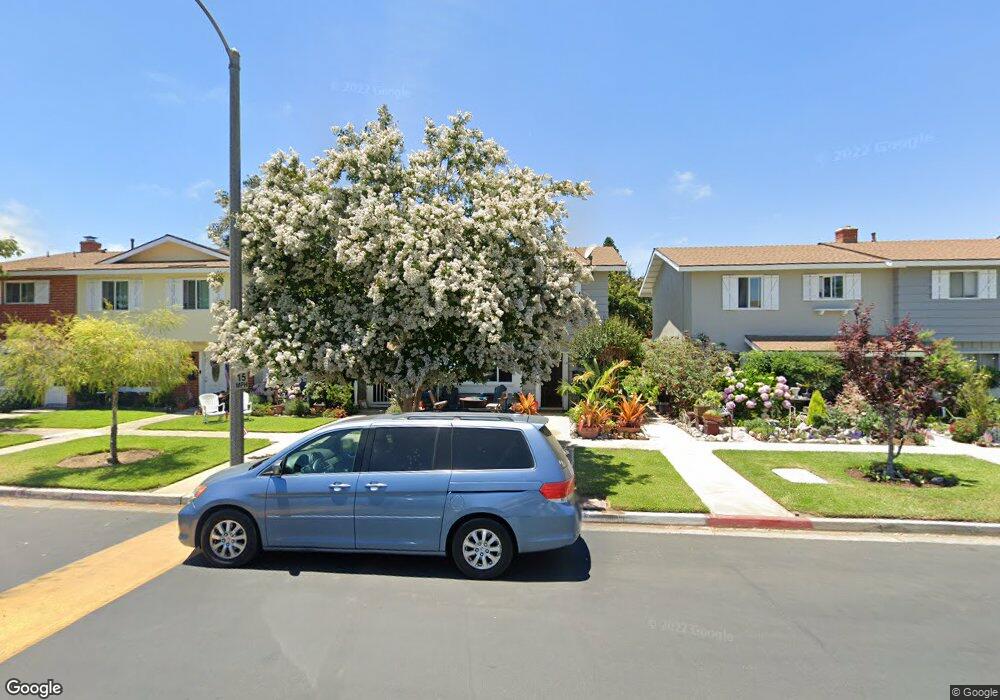
19867 Piccadilly Ln Huntington Beach, CA 92646
Estimated Value: $736,000 - $867,000
3
Beds
2
Baths
1,122
Sq Ft
$705/Sq Ft
Est. Value
About This Home
This home is located at 19867 Piccadilly Ln, Huntington Beach, CA 92646 and is currently estimated at $791,008, approximately $704 per square foot. 19867 Piccadilly Ln is a home located in Orange County with nearby schools including Isojiro Oka Elementary, Talbert Middle School, and Edison High School.
Ownership History
Date
Name
Owned For
Owner Type
Purchase Details
Closed on
Dec 16, 2021
Sold by
Grego Robert Michael and Gr Victoria
Bought by
Marsh Bryan and Marsh Cherise
Current Estimated Value
Home Financials for this Owner
Home Financials are based on the most recent Mortgage that was taken out on this home.
Original Mortgage
$460,000
Outstanding Balance
$423,079
Interest Rate
3.11%
Mortgage Type
New Conventional
Estimated Equity
$367,929
Purchase Details
Closed on
Aug 30, 2001
Sold by
Grego Robert Michael and Grego Victoria Ann
Bought by
Grego Robert Michael and Grego Victoria Ann
Purchase Details
Closed on
Aug 22, 2000
Sold by
Va
Bought by
Grego Robert and Grego Victoria
Purchase Details
Closed on
Jan 18, 1994
Sold by
Monroe Theda
Bought by
Va
Create a Home Valuation Report for This Property
The Home Valuation Report is an in-depth analysis detailing your home's value as well as a comparison with similar homes in the area
Home Values in the Area
Average Home Value in this Area
Purchase History
| Date | Buyer | Sale Price | Title Company |
|---|---|---|---|
| Marsh Bryan | $575,000 | Lawyers Title | |
| Grego Robert Michael | -- | -- | |
| Grego Robert Michael | -- | -- | |
| Grego Robert | $167,000 | Chicago Title Co | |
| Va | $114,000 | Fidelity National Title Ins |
Source: Public Records
Mortgage History
| Date | Status | Borrower | Loan Amount |
|---|---|---|---|
| Open | Marsh Bryan | $460,000 |
Source: Public Records
Tax History Compared to Growth
Tax History
| Year | Tax Paid | Tax Assessment Tax Assessment Total Assessment is a certain percentage of the fair market value that is determined by local assessors to be the total taxable value of land and additions on the property. | Land | Improvement |
|---|---|---|---|---|
| 2025 | $6,929 | $610,194 | $552,953 | $57,241 |
| 2024 | $6,929 | $598,230 | $542,111 | $56,119 |
| 2023 | $6,767 | $586,500 | $531,481 | $55,019 |
| 2022 | $2,966 | $237,117 | $174,512 | $62,605 |
| 2021 | $2,910 | $232,468 | $171,090 | $61,378 |
| 2020 | $2,892 | $230,085 | $169,336 | $60,749 |
| 2019 | $2,837 | $225,574 | $166,016 | $59,558 |
| 2018 | $2,785 | $221,151 | $162,760 | $58,391 |
| 2017 | $2,741 | $216,815 | $159,568 | $57,247 |
| 2016 | $2,631 | $212,564 | $156,439 | $56,125 |
| 2015 | $2,591 | $209,372 | $154,090 | $55,282 |
| 2014 | $2,540 | $205,271 | $151,071 | $54,200 |
Source: Public Records
Map
Nearby Homes
- 19880 Berkshire Ln
- 10022 Bismark Dr
- 19941 Carmania Ln
- 19922 Carmania Ln
- 19774 Cambridge Ln
- 9831 Continental Dr
- 19860 Claremont Ln
- 19843 Coventry Ln
- 9745 Cornwall Dr
- 2761 Sandpiper Dr
- 10172 Stonybrook Dr
- 2741 Sandpiper Dr
- 9695 Adams Ave
- 19854 Leighton Ln
- 9667 Durham Dr
- 19901 Burnley Ln
- 2021 Kornat Dr
- 19361 Brookhurst St Unit 87
- 19361 Brookhurst St Unit 50
- 19361 Brookhurst St Unit 184
- 19871 Piccadilly Ln
- 19861 Piccadilly Ln
- 19877 Piccadilly Ln
- 10171 Disney Cir
- 19857 Piccadilly Ln
- 19881 Piccadilly Ln
- 10169 Disney Cir
- 19851 Piccadilly Ln
- 19887 Piccadilly Ln
- 10167 Disney Cir
- 10172 Holburn Dr
- 19847 Piccadilly Ln
- 10170 Holburn Dr
- 19891 Piccadilly Ln
- 10165 Disney Cir
- 10168 Holburn Dr
- 10163 Disney Cir
- 10166 Holburn Dr
- 19868 Piccadilly Ln