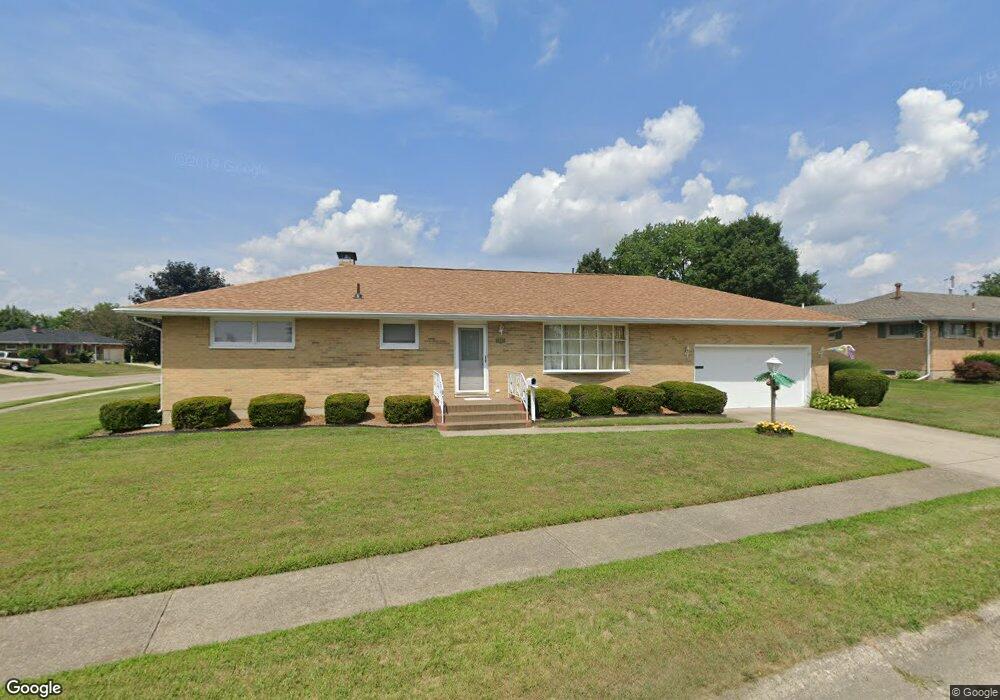
1987 Kimberly Cir Springfield, OH 45503
Estimated Value: $253,000 - $264,565
2
Beds
2
Baths
1,421
Sq Ft
$182/Sq Ft
Est. Value
About This Home
This home is located at 1987 Kimberly Cir, Springfield, OH 45503 and is currently estimated at $259,141, approximately $182 per square foot. 1987 Kimberly Cir is a home located in Clark County with nearby schools including Northridge Elementary School, Kenton Ridge Middle & High School, and Emmanuel Christian Academy.
Ownership History
Date
Name
Owned For
Owner Type
Purchase Details
Closed on
Aug 28, 2003
Sold by
Dean Tanya S
Bought by
Dean Kerry L
Current Estimated Value
Home Financials for this Owner
Home Financials are based on the most recent Mortgage that was taken out on this home.
Original Mortgage
$128,132
Outstanding Balance
$57,753
Interest Rate
6.18%
Mortgage Type
FHA
Estimated Equity
$201,388
Purchase Details
Closed on
Jun 28, 2001
Sold by
Beebee Marilyn W and Beebee Paul K
Bought by
Dean Kerry L and Dean Tanya S
Home Financials for this Owner
Home Financials are based on the most recent Mortgage that was taken out on this home.
Original Mortgage
$99,688
Interest Rate
7.18%
Mortgage Type
FHA
Purchase Details
Closed on
Dec 28, 1994
Sold by
Marguerite B Henry Est
Bought by
Beebee Paul K and Beebee Marilyn
Home Financials for this Owner
Home Financials are based on the most recent Mortgage that was taken out on this home.
Original Mortgage
$68,000
Interest Rate
7.62%
Mortgage Type
New Conventional
Create a Home Valuation Report for This Property
The Home Valuation Report is an in-depth analysis detailing your home's value as well as a comparison with similar homes in the area
Home Values in the Area
Average Home Value in this Area
Purchase History
We collect this data history from publicly available records. To have your information removed, we recommend requesting removal directly through your county’s website.
| Date | Buyer | Sale Price | Title Company |
|---|---|---|---|
| Dean Kerry L | -- | -- | |
| Dean Kerry L | $102,500 | -- | |
| Beebee Paul K | $85,000 | -- |
Source: Public Records
Mortgage History
We collect this data history from publicly available records. To have your information removed, we recommend requesting removal directly through your county’s website.
| Date | Status | Borrower | Loan Amount |
|---|---|---|---|
| Open | Dean Kerry L | $128,132 | |
| Closed | Dean Kerry L | $99,688 | |
| Previous Owner | Beebee Paul K | $68,000 |
Source: Public Records
Tax History
| Year | Tax Paid | Tax Assessment Tax Assessment Total Assessment is a certain percentage of the fair market value that is determined by local assessors to be the total taxable value of land and additions on the property. | Land | Improvement |
|---|---|---|---|---|
| 2025 | $2,459 | $87,370 | $17,200 | $70,170 |
| 2024 | $2,405 | $66,040 | $11,510 | $54,530 |
| 2023 | $2,405 | $66,040 | $11,510 | $54,530 |
| 2022 | $2,432 | $66,040 | $11,510 | $54,530 |
| 2021 | $2,207 | $52,830 | $9,140 | $43,690 |
| 2020 | $2,209 | $52,830 | $9,140 | $43,690 |
| 2019 | $2,251 | $52,830 | $9,140 | $43,690 |
| 2018 | $1,950 | $45,390 | $8,190 | $37,200 |
| 2017 | $1,671 | $46,862 | $8,190 | $38,672 |
| 2016 | $1,659 | $46,862 | $8,190 | $38,672 |
| 2015 | $1,609 | $44,324 | $7,875 | $36,449 |
| 2014 | $1,609 | $44,324 | $7,875 | $36,449 |
| 2013 | $1,571 | $44,324 | $7,875 | $36,449 |
Source: Public Records
Map
Nearby Homes
- 4385 Helena Ct
- 4028 Ryland Dr Unit 4028
- 4250 Midfield St
- 1415 Montego Dr
- 4512 Ridgewood Rd E
- 1505 Kingsgate Rd
- 1503 Kingsgate Rd
- 1507 Kingsgate Rd
- 4008 Bosart Rd
- 4642 Laredo St
- 1500 Kingsgate Rd Unit 19430
- 1502 Kingsgate Rd Unit 19432
- 1500 Kingsgate Rd
- 1502 Kingsgate Rd
- 1341 Student Ave
- 3631 Kingsgate Ln
- 4732 Lehigh Dr
- 4528 W Ridgewood Rd
- 4898 Brannan Dr E
- 4917 Auston St
- 1914 Montego Dr
- 1975 Kimberly Cir
- 1936 Montego Dr
- 1906 Montego Dr
- 1980 Kimberly Cir
- 1969 Kimberly Cir
- 1925 Montego Dr
- 1917 Montego Dr
- 1972 Kimberly Cir
- 1933 Montego Dr
- 1919 Kimberly Cir
- 1909 Montego Dr
- 1911 Kimberly Cir
- 1927 Kimberly Cir
- 1840 Montego Dr
- 1951 Kimberly Cir
- 1901 Montego Dr
- 1941 Montego Dr
- 1966 Kimberly Cir
- 1950 Montego Dr
Your Personal Tour Guide
Ask me questions while you tour the home.