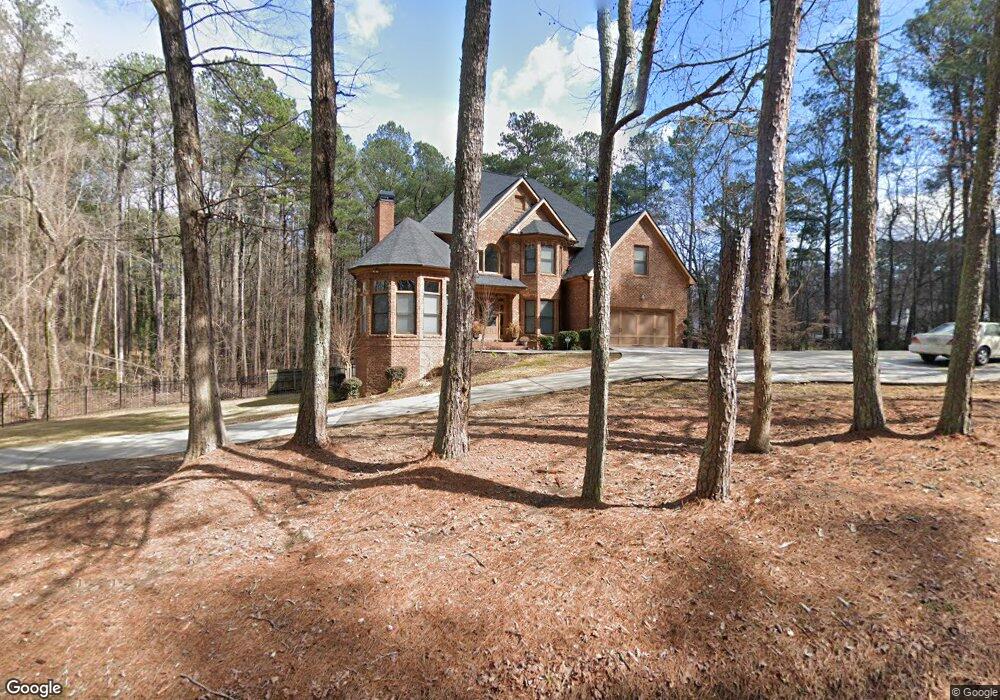
1988 Parkwood Rd Snellville, GA 30078
Estimated Value: $692,000 - $767,239
5
Beds
5
Baths
3,456
Sq Ft
$208/Sq Ft
Est. Value
About This Home
This home is located at 1988 Parkwood Rd, Snellville, GA 30078 and is currently estimated at $720,060, approximately $208 per square foot. 1988 Parkwood Rd is a home located in Gwinnett County with nearby schools including Head Elementary School, Five Forks Middle School, and Brookwood High School.
Ownership History
Date
Name
Owned For
Owner Type
Purchase Details
Closed on
Sep 17, 2010
Sold by
Federal Natl Mtg Assn Fnma
Bought by
Jones Michael A and Williams-Jones Hope
Current Estimated Value
Home Financials for this Owner
Home Financials are based on the most recent Mortgage that was taken out on this home.
Original Mortgage
$335,383
Outstanding Balance
$220,402
Interest Rate
4.5%
Mortgage Type
FHA
Estimated Equity
$499,658
Purchase Details
Closed on
Dec 1, 2009
Sold by
Citimortgage Inc
Bought by
Federal Natl Mtg Assn Fnma
Purchase Details
Closed on
May 1, 2006
Sold by
Solid Const Llc
Bought by
Hayashi Misun L
Home Financials for this Owner
Home Financials are based on the most recent Mortgage that was taken out on this home.
Original Mortgage
$486,000
Interest Rate
7.42%
Mortgage Type
New Conventional
Purchase Details
Closed on
Apr 28, 2004
Sold by
Waterton Godfrey T and Waterton Vanessa
Bought by
Solid Const Llc
Home Financials for this Owner
Home Financials are based on the most recent Mortgage that was taken out on this home.
Original Mortgage
$375,000
Interest Rate
5.36%
Create a Home Valuation Report for This Property
The Home Valuation Report is an in-depth analysis detailing your home's value as well as a comparison with similar homes in the area
Home Values in the Area
Average Home Value in this Area
Purchase History
| Date | Buyer | Sale Price | Title Company |
|---|---|---|---|
| Jones Michael A | $339,000 | -- | |
| Federal Natl Mtg Assn Fnma | -- | -- | |
| Citimortgage Inc | $451,981 | -- | |
| Hayashi Misun L | $540,000 | -- | |
| Solid Const Llc | $75,000 | -- |
Source: Public Records
Mortgage History
| Date | Status | Borrower | Loan Amount |
|---|---|---|---|
| Open | Jones Michael A | $335,383 | |
| Previous Owner | Hayashi Misun L | $486,000 | |
| Previous Owner | Solid Const Llc | $375,000 |
Source: Public Records
Tax History Compared to Growth
Tax History
| Year | Tax Paid | Tax Assessment Tax Assessment Total Assessment is a certain percentage of the fair market value that is determined by local assessors to be the total taxable value of land and additions on the property. | Land | Improvement |
|---|---|---|---|---|
| 2025 | $9,690 | $328,200 | $58,760 | $269,440 |
| 2024 | $9,890 | $328,200 | $58,760 | $269,440 |
| 2023 | $9,890 | $328,200 | $58,760 | $269,440 |
| 2022 | $8,644 | $268,720 | $29,400 | $239,320 |
| 2021 | $8,814 | $268,720 | $29,400 | $239,320 |
| 2020 | $8,878 | $268,720 | $29,400 | $239,320 |
| 2019 | $7,004 | $193,880 | $26,120 | $167,760 |
| 2018 | $7,021 | $193,880 | $26,120 | $167,760 |
| 2016 | $7,037 | $193,880 | $26,120 | $167,760 |
| 2015 | $7,332 | $193,880 | $26,120 | $167,760 |
| 2014 | -- | $144,680 | $24,840 | $119,840 |
Source: Public Records
Map
Nearby Homes
- 3588 Kelin Ct SW
- 3594 Hedgestone Ln
- 2350 Action Way
- 1893 Hedgestone Ct
- 2167 Foley Park St
- 2286 Foley Park St
- 3728 Kelin Ct SW
- 1795 Elmwood Cir
- 2034 Britt Dr
- 1904 Britt Dr
- 1776 Bear Cave SW
- 3487 Desoto Rd
- 2546 Tullamore Cir
- 2296 Thackery Rd
- 1721 Bruckner Ct
- 1905 Embassy Walk Ln
- 2325 Thackery Rd
- 3725 Hunting Ridge Dr SW
- 3430 Park Glenn Ln
- 4000 Embassy Way
- 3535 Parkwood Hills Ct
- 3545 Parkwood Hills Ct
- 3525 Parkwood Hills Ct
- 1987 Parkwood Rd
- 1987 Parkwood Rd Unit R6033 058
- 0 Parkwood Hills Ct
- 3515 Parkwood Hills Ct
- 2003 Parkwood Rd
- 1957 Parkwood Rd
- 3504 W Elmwood Cir
- 2013 Parkwood Rd
- 3500 Parkwood Hills Ct
- 3520 Parkwood Hills Ct
- 1953 Parkwood Rd Unit B
- 1953 Parkwood Rd Unit A
- 1953 Parkwood Rd
- 3540 Parkwood Hills Ct
- 3530 Parkwood Hills Ct
- 2033 Parkwood Rd
- 2033 Parkwood Rd Unit 112