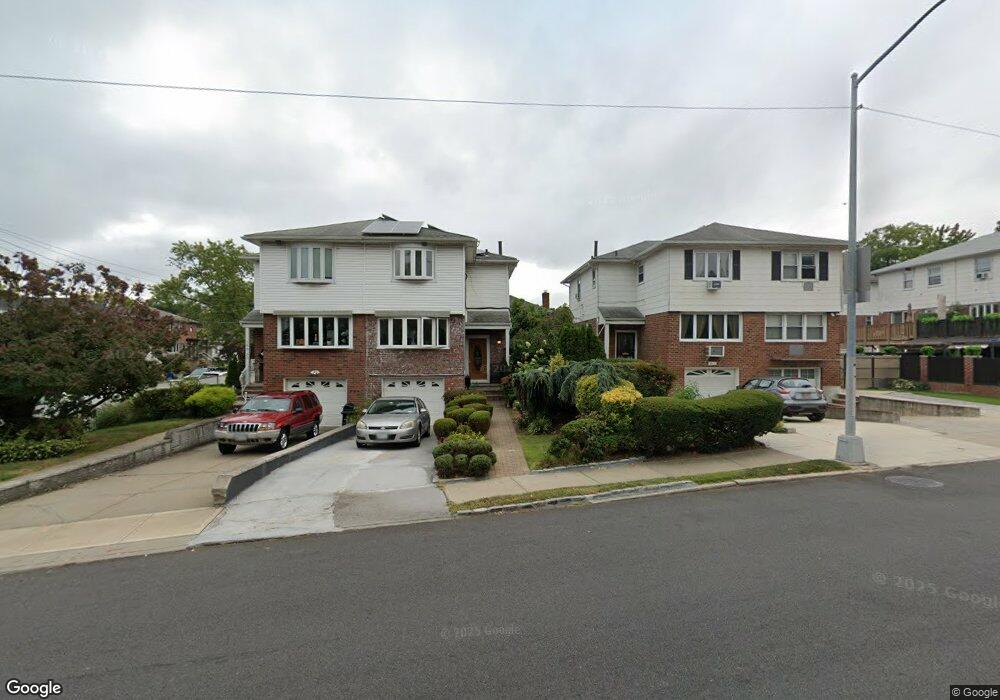
19918 Cross Island Pkwy Whitestone, NY 11357
Clearview NeighborhoodEstimated Value: $998,469 - $1,097,000
3
Beds
2
Baths
1,826
Sq Ft
$575/Sq Ft
Est. Value
About This Home
This home is located at 19918 Cross Island Pkwy, Whitestone, NY 11357 and is currently estimated at $1,050,617, approximately $575 per square foot. 19918 Cross Island Pkwy is a home located in Queens County with nearby schools including P.S. 209 - Clearview Gardens, J.H.S. 194 William Carr, and Bayside High School.
Ownership History
Date
Name
Owned For
Owner Type
Purchase Details
Closed on
Mar 25, 1999
Sold by
Chan Cherona S and Chan Ida
Bought by
Acolentaba Althea Jola
Current Estimated Value
Home Financials for this Owner
Home Financials are based on the most recent Mortgage that was taken out on this home.
Original Mortgage
$220,000
Outstanding Balance
$54,155
Interest Rate
6.95%
Estimated Equity
$996,462
Purchase Details
Closed on
Nov 14, 1995
Sold by
Nunez Jose F and Nunez Lucia
Bought by
Chan Cherona S and Chan Ida
Home Financials for this Owner
Home Financials are based on the most recent Mortgage that was taken out on this home.
Original Mortgage
$168,000
Interest Rate
7.43%
Mortgage Type
Balloon
Create a Home Valuation Report for This Property
The Home Valuation Report is an in-depth analysis detailing your home's value as well as a comparison with similar homes in the area
Home Values in the Area
Average Home Value in this Area
Purchase History
| Date | Buyer | Sale Price | Title Company |
|---|---|---|---|
| Acolentaba Althea Jola | $275,000 | Chicago Title Insurance Co | |
| Chan Cherona S | $210,000 | Title Usa Insurance Corp |
Source: Public Records
Mortgage History
| Date | Status | Borrower | Loan Amount |
|---|---|---|---|
| Open | Acolentaba Althea Jola | $220,000 | |
| Previous Owner | Chan Cherona S | $168,000 |
Source: Public Records
Tax History Compared to Growth
Tax History
| Year | Tax Paid | Tax Assessment Tax Assessment Total Assessment is a certain percentage of the fair market value that is determined by local assessors to be the total taxable value of land and additions on the property. | Land | Improvement |
|---|---|---|---|---|
| 2025 | $9,658 | $50,969 | $10,872 | $40,097 |
| 2024 | $9,658 | $48,085 | $11,619 | $36,466 |
| 2023 | $9,111 | $45,364 | $9,365 | $35,999 |
| 2022 | $8,544 | $55,920 | $13,860 | $42,060 |
| 2021 | $8,711 | $59,040 | $13,860 | $45,180 |
| 2020 | $8,694 | $54,060 | $13,860 | $40,200 |
| 2019 | $8,090 | $59,580 | $13,860 | $45,720 |
| 2018 | $7,409 | $37,803 | $10,821 | $26,982 |
| 2017 | $6,971 | $35,665 | $10,133 | $25,532 |
| 2016 | $6,820 | $35,665 | $10,133 | $25,532 |
| 2015 | $3,838 | $35,395 | $11,161 | $24,234 |
| 2014 | $3,838 | $33,393 | $11,708 | $21,685 |
Source: Public Records
Map
Nearby Homes
- 1463 Burton St
- 166-27 16th Ave
- 16515 Cross Island Pkwy
- 16-37 Utopia Pkwy Unit 2-33
- 15-42 166th St
- 163-49 15th Dr
- 5 Boulevard
- 200-07 17th Ave
- 163-37 15th Dr
- 163-28 15th Dr
- 166-65 17th Rd
- 166-61 17th Rd
- 17-11 201st St
- 163-49 16th Ave
- 17-24 201st St Unit 2-120
- 13-36 Robin Ln Unit 70 U
- 163-86 17th Ave Unit 4-113
- 166-30 17th Rd Unit 2
- 166-30 17th Rd Unit 3-106
- 12-35 Robin Ln Unit Upper
- 19920 Cross Island Pkwy Unit 2&3FL
- 19920 Cross Island Pkwy
- 19920 Cross Island Pkwy
- 19918 Cross Island Pkwy
- 19914 Cross Island Pkwy
- 19912 Cross Island Pkwy
- 19912 Cross Island Pkwy
- 19912 Cross Island Pkwy
- 1514 200th St
- 1514 200th St Unit 2
- 1514 200th St Unit 2F
- 1514 200th St Unit 1
- 1514 200th St Unit 1 Fl
- 1514 200th St Unit 2
- 1514 200th St Unit 1 Fl
- 1518 200th St
- 1509 Utopia Pkwy
- 1503 Utopia Pkwy
- 1505 Utopia Pkwy
- 20004 Cross Island Pkwy