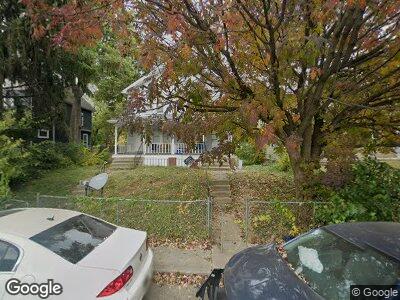
1992 Fairmont Ave Unit 994 Columbus, OH 43223
Central Hilltop NeighborhoodEstimated Value: $186,000 - $222,101
6
Beds
2
Baths
2,480
Sq Ft
$82/Sq Ft
Est. Value
About This Home
This home is located at 1992 Fairmont Ave Unit 994, Columbus, OH 43223 and is currently estimated at $202,775, approximately $81 per square foot. 1992 Fairmont Ave Unit 994 is a home located in Franklin County with nearby schools including Highland Elementary School, Westmoor Middle School, and West High School.
Ownership History
Date
Name
Owned For
Owner Type
Purchase Details
Closed on
Feb 9, 2024
Sold by
Alife42morrow Llc
Bought by
Alife42morrow Llc
Current Estimated Value
Purchase Details
Closed on
Oct 16, 2019
Sold by
Comstock Troy and Comstock Jill
Bought by
Alife42morrow Llc
Home Financials for this Owner
Home Financials are based on the most recent Mortgage that was taken out on this home.
Original Mortgage
$91,426
Interest Rate
3.6%
Mortgage Type
Commercial
Purchase Details
Closed on
Aug 7, 2006
Sold by
Tewksbury Ted L and Tewksbury Myra L
Bought by
Comstock Troy and Comstock Jill
Home Financials for this Owner
Home Financials are based on the most recent Mortgage that was taken out on this home.
Original Mortgage
$54,675
Interest Rate
6.85%
Mortgage Type
Purchase Money Mortgage
Purchase Details
Closed on
May 3, 1982
Bought by
Tewksbury Ted L and Tewksbury Myra L
Create a Home Valuation Report for This Property
The Home Valuation Report is an in-depth analysis detailing your home's value as well as a comparison with similar homes in the area
Home Values in the Area
Average Home Value in this Area
Purchase History
| Date | Buyer | Sale Price | Title Company |
|---|---|---|---|
| Alife42morrow Llc | $173,500 | None Listed On Document | |
| Alife42morrow Llc | $97,200 | None Available | |
| Comstock Troy | $72,900 | Independent | |
| Tewksbury Ted L | -- | -- |
Source: Public Records
Mortgage History
| Date | Status | Borrower | Loan Amount |
|---|---|---|---|
| Previous Owner | Alife42morrow Llc | $91,426 | |
| Previous Owner | Comstock Troy | $54,675 | |
| Previous Owner | Comstock Troy | $18,225 |
Source: Public Records
Tax History Compared to Growth
Tax History
| Year | Tax Paid | Tax Assessment Tax Assessment Total Assessment is a certain percentage of the fair market value that is determined by local assessors to be the total taxable value of land and additions on the property. | Land | Improvement |
|---|---|---|---|---|
| 2024 | $3,598 | $59,850 | $5,320 | $54,530 |
| 2023 | $3,376 | $59,850 | $5,320 | $54,530 |
| 2022 | $1,258 | $17,850 | $3,290 | $14,560 |
| 2021 | $1,633 | $17,850 | $3,290 | $14,560 |
| 2020 | $1,102 | $17,850 | $3,290 | $14,560 |
| 2019 | $925 | $14,880 | $2,770 | $12,110 |
| 2018 | $912 | $14,880 | $2,770 | $12,110 |
| 2017 | $957 | $14,880 | $2,770 | $12,110 |
| 2016 | $990 | $14,570 | $4,450 | $10,120 |
| 2015 | $901 | $14,570 | $4,450 | $10,120 |
| 2014 | $903 | $14,570 | $4,450 | $10,120 |
| 2013 | $524 | $17,115 | $5,215 | $11,900 |
Source: Public Records
Map
Nearby Homes
- 1953 Fairmont Ave Unit 955
- 1931 W Broad St Unit 933
- 2011 Fairmont Ave
- 2045 W Broad St
- 1923 Floral Ave
- 83 Belvidere Ave
- 44 Whitethorne Ave
- 42 Whitethorne Ave
- 139 Belvidere Ave
- 34-36 Midland Ave
- 221 Columbian Ave
- 196 Whitethorne Ave
- 219 Belvidere Ave
- 148-150 Midland Ave
- 95 Midland Ave
- 273 Wrexham Ave
- 204 Midland Ave
- 287 Wrexham Ave
- 2219 W Broad St
- 298 Clarendon Ave
- 1992 Fairmont Ave Unit 994
- 1992-1994 Fairmont Ave
- 1992 Fairmont Ave Unit 4
- 1986 Fairmont Ave Unit 988
- 2000 Fairmont Ave
- 1982 Fairmont Ave
- 2002 Fairmont Ave Unit 4
- 2002-2004 Fairmont Ave
- 2004 Fairmont Ave Unit 4
- 2008 Fairmont Ave Unit 10
- 2005 Fairmont Ave
- 2014 Fairmont Ave Unit 16
- 2014-2016 Fairmont Ave
- 1991 Fairmont Ave
- 1966 Fairmont Ave Unit 968
- 1987 Fairmont Ave
- 1997 W Broad St Unit 999
- 1995 Fairmont Ave
- 1997-1999 W Broad St
- 1981 Fairmont Ave