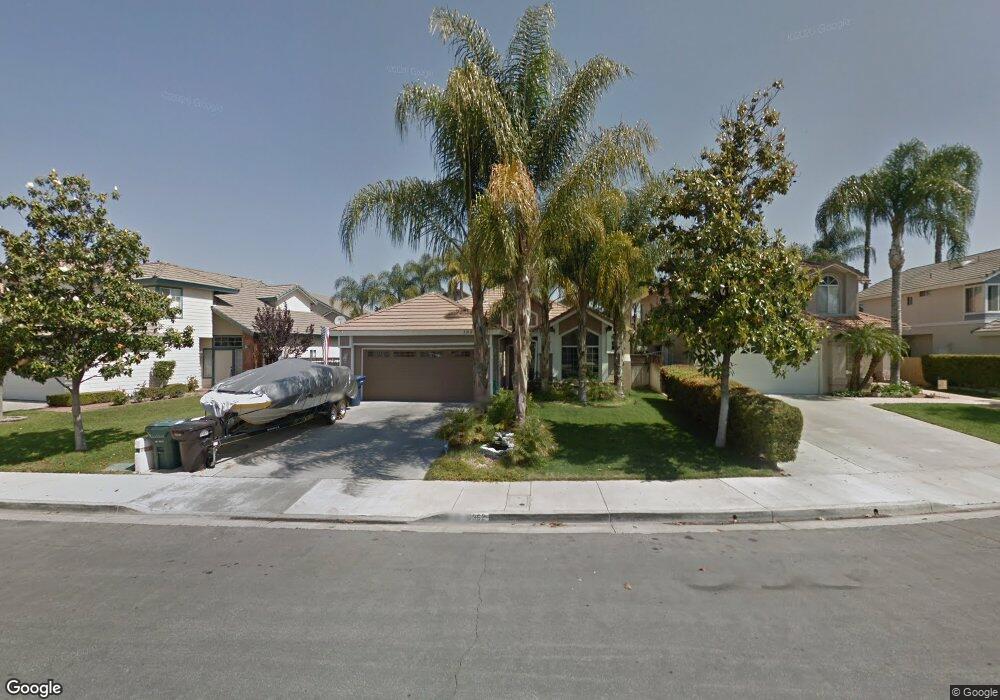
19962 Nipoma Ct Riverside, CA 92508
Orangecrest NeighborhoodEstimated Value: $639,862 - $669,000
3
Beds
2
Baths
1,557
Sq Ft
$423/Sq Ft
Est. Value
About This Home
This home is located at 19962 Nipoma Ct, Riverside, CA 92508 and is currently estimated at $658,966, approximately $423 per square foot. 19962 Nipoma Ct is a home located in Riverside County with nearby schools including Benjamin Franklin Elementary School, Amelia Earhart Middle School, and Martin Luther King Junior High School.
Ownership History
Date
Name
Owned For
Owner Type
Purchase Details
Closed on
Aug 9, 1995
Sold by
Cvengros John D and Cvengros Gayle E
Bought by
Newman Shawn C and Newman Cynthia L
Current Estimated Value
Home Financials for this Owner
Home Financials are based on the most recent Mortgage that was taken out on this home.
Original Mortgage
$114,315
Interest Rate
7.59%
Mortgage Type
FHA
Create a Home Valuation Report for This Property
The Home Valuation Report is an in-depth analysis detailing your home's value as well as a comparison with similar homes in the area
Home Values in the Area
Average Home Value in this Area
Purchase History
| Date | Buyer | Sale Price | Title Company |
|---|---|---|---|
| Newman Shawn C | $115,000 | Commonwealth Land Title |
Source: Public Records
Mortgage History
| Date | Status | Borrower | Loan Amount |
|---|---|---|---|
| Previous Owner | Newman Shawn C | $114,315 |
Source: Public Records
Tax History
| Year | Tax Paid | Tax Assessment Tax Assessment Total Assessment is a certain percentage of the fair market value that is determined by local assessors to be the total taxable value of land and additions on the property. | Land | Improvement |
|---|---|---|---|---|
| 2025 | $2,522 | $237,005 | $58,123 | $178,882 |
| 2023 | $2,522 | $227,804 | $55,867 | $171,937 |
| 2022 | $2,462 | $223,338 | $54,772 | $168,566 |
| 2021 | $2,437 | $218,960 | $53,699 | $165,261 |
| 2020 | $2,418 | $216,716 | $53,149 | $163,567 |
| 2019 | $2,371 | $212,467 | $52,107 | $160,360 |
| 2018 | $2,325 | $208,302 | $51,087 | $157,215 |
| 2017 | $2,283 | $204,219 | $50,086 | $154,133 |
| 2016 | $2,137 | $200,215 | $49,104 | $151,111 |
| 2015 | $2,105 | $197,210 | $48,367 | $148,843 |
| 2014 | $2,165 | $193,348 | $47,420 | $145,928 |
Source: Public Records
Map
Nearby Homes
- 19971 Westerly Dr
- 19911 Westerly Dr
- 9036 Limecrest Dr
- 19972 Windwood Cir
- 0 Apn#267-180-003 Unit CV22145370
- 0 Old Frontage Rd Unit OC25137111
- 9131 Santa Barbara Dr
- 9146 Rangpur Cir
- 8470 Lindenhurst St
- 8634 Cabin Place
- 20329 Red Poppy Ln
- 8720 Coyote Bush Rd
- 6932 Lucia St
- 20228 June Ct
- 19689 Allenhurst St
- 8449 Monique Ct
- 19202 Bergamont Dr
- 19320 Totem Ct
- 9549 Calico Trail
- 8564 Mill Pond Place
- 19972 Nipoma Ct
- 19952 Nipoma Ct
- 19982 Nipoma Ct
- 19965 Saint Francis Dr
- 19957 Saint Francis Dr
- 19942 Nipoma Ct
- 19973 Saint Francis Dr
- 19949 Saint Francis Dr
- 19981 Saint Francis Dr
- 19932 Nipoma Ct
- 19992 Nipoma Ct
- 19963 Nipoma Ct
- 19941 Saint Francis Dr
- 19957 Nipoma Ct
- 19969 Nipoma Ct
- 19989 Saint Francis Dr
- 19951 Nipoma Ct
- 19987 Nipoma Ct
- 19922 Nipoma Ct
- 19945 Nipoma Ct
Your Personal Tour Guide
Ask me questions while you tour the home.