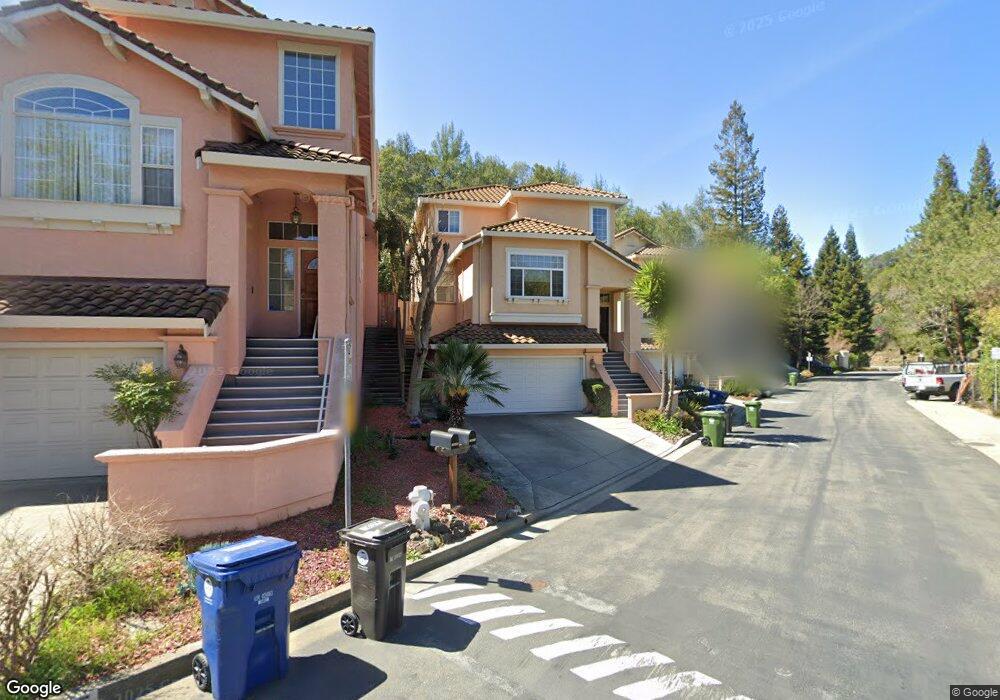
19971 Crow Creek Rd Castro Valley, CA 94552
Castro Valley East NeighborhoodEstimated Value: $1,336,000 - $1,545,000
4
Beds
3
Baths
2,746
Sq Ft
$541/Sq Ft
Est. Value
About This Home
This home is located at 19971 Crow Creek Rd, Castro Valley, CA 94552 and is currently estimated at $1,484,362, approximately $540 per square foot. 19971 Crow Creek Rd is a home located in Alameda County with nearby schools including Independent Elementary School, Canyon Middle School, and Creekside Middle School.
Ownership History
Date
Name
Owned For
Owner Type
Purchase Details
Closed on
Feb 5, 2015
Sold by
Wong Rose
Bought by
Wong Rose and Rose Wong Survivors Trust
Current Estimated Value
Purchase Details
Closed on
Jul 24, 2007
Sold by
Nicholson Michael and Bunstock Susan M
Bought by
Wong Dudley and Wong Sherri
Home Financials for this Owner
Home Financials are based on the most recent Mortgage that was taken out on this home.
Original Mortgage
$185,000
Outstanding Balance
$116,594
Interest Rate
6.66%
Mortgage Type
Purchase Money Mortgage
Estimated Equity
$1,367,768
Purchase Details
Closed on
Dec 21, 1995
Sold by
Nicholson Michael D and Bunstock Susan M
Bought by
Nicholson Michael and Bunstock Susan M
Home Financials for this Owner
Home Financials are based on the most recent Mortgage that was taken out on this home.
Original Mortgage
$280,800
Interest Rate
7.5%
Create a Home Valuation Report for This Property
The Home Valuation Report is an in-depth analysis detailing your home's value as well as a comparison with similar homes in the area
Home Values in the Area
Average Home Value in this Area
Purchase History
| Date | Buyer | Sale Price | Title Company |
|---|---|---|---|
| Wong Rose | -- | None Available | |
| Wong Dudley | $840,000 | Old Republic Title Company | |
| Nicholson Michael | -- | First American Title Guarant |
Source: Public Records
Mortgage History
| Date | Status | Borrower | Loan Amount |
|---|---|---|---|
| Open | Wong Dudley | $185,000 | |
| Previous Owner | Nicholson Michael | $280,800 |
Source: Public Records
Tax History Compared to Growth
Tax History
| Year | Tax Paid | Tax Assessment Tax Assessment Total Assessment is a certain percentage of the fair market value that is determined by local assessors to be the total taxable value of land and additions on the property. | Land | Improvement |
|---|---|---|---|---|
| 2025 | $13,505 | $1,096,280 | $330,984 | $772,296 |
| 2024 | $13,505 | $1,074,650 | $324,495 | $757,155 |
| 2023 | $13,301 | $1,060,448 | $318,134 | $742,314 |
| 2022 | $13,055 | $1,032,658 | $311,897 | $727,761 |
| 2021 | $12,725 | $1,012,280 | $305,784 | $713,496 |
| 2020 | $12,436 | $1,008,831 | $302,649 | $706,182 |
| 2019 | $12,672 | $989,057 | $296,717 | $692,340 |
| 2018 | $12,315 | $969,670 | $290,901 | $678,769 |
| 2017 | $11,993 | $950,661 | $285,198 | $665,463 |
| 2016 | $11,412 | $932,021 | $279,606 | $652,415 |
| 2015 | $9,770 | $837,000 | $251,100 | $585,900 |
| 2014 | $9,505 | $806,000 | $241,800 | $564,200 |
Source: Public Records
Map
Nearby Homes
- 4937 Crow Canyon Rd
- 5288 Crown Ct
- 5389 San Simeon Place
- 21798 Independent School Rd
- 4597 Edwards Ln
- 3594 Cama Ln
- 5529 Feather Ct
- 19430 Center St
- 4525 Edwards Ln
- 5605 Greenridge Rd
- 0 Jensen Rd Unit 41089385
- 5665 Shadow Ridge Dr
- 4314 Shamrock Way
- 18698 Cull Canyon Rd
- 19554 Jaydine St
- 5030 Ray Ave
- 18798 Madison Ave
- 3285 Monika Ln
- 3264 Monika Ln
- 22679 Valley View Dr
- 19995 Crow Creek Rd
- 20019 Crow Creek Rd
- 19923 Crow Creek Rd
- 20043 Crow Creek Rd
- 19899 Crow Creek Rd
- 20067 Crow Creek Rd
- 19875 Crow Creek Rd
- 20091 Crow Creek Rd
- 5034 Beacon Hill Dr
- 20115 Crow Creek Rd
- 19901 Presidio Ct
- 20139 Crow Creek Rd
- 4997 Beacon Hill Dr
- 19920 Presidio Ct
- 20163 Crow Creek Rd
- 19900 Presidio Ct
- 5028 Beacon Hill Dr
- 20187 Crow Creek Rd
- 5182 Crow Canyon Rd
- 20183 Waterford Place