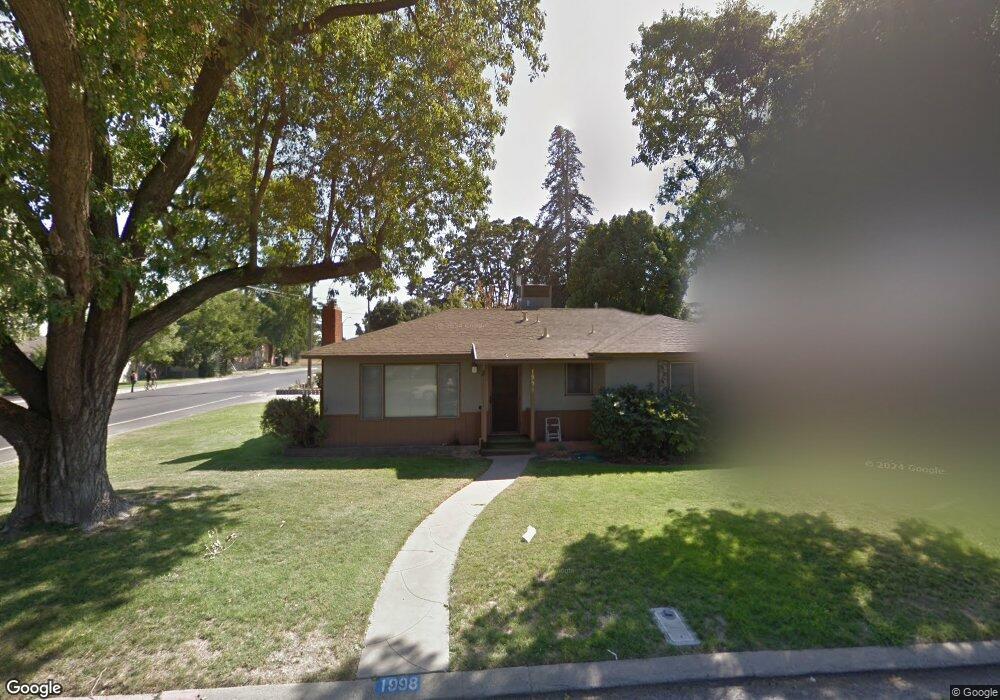
1998 Charles Place Turlock, CA 95380
Estimated Value: $344,940 - $495,000
3
Beds
1
Bath
1,128
Sq Ft
$369/Sq Ft
Est. Value
About This Home
This home is located at 1998 Charles Place, Turlock, CA 95380 and is currently estimated at $416,735, approximately $369 per square foot. 1998 Charles Place is a home located in Stanislaus County with nearby schools including Julien Elementary School, Marvin A. Dutcher Middle School, and Turlock Junior High School.
Ownership History
Date
Name
Owned For
Owner Type
Purchase Details
Closed on
May 7, 2024
Sold by
Jones Douglas Ferrell
Bought by
Jones Douglas Ferrell and Grubb Nancy Jennifer
Current Estimated Value
Home Financials for this Owner
Home Financials are based on the most recent Mortgage that was taken out on this home.
Original Mortgage
$60,000
Interest Rate
6.79%
Mortgage Type
Balloon
Purchase Details
Closed on
Feb 16, 2019
Sold by
Jones Ferrell E and Jones Yvonne M
Bought by
Jones Douglas Ferrell
Purchase Details
Closed on
Oct 10, 2011
Sold by
Olson Lee and Raymond M Olson 2011 Revocable
Bought by
Jones E Ferrell and Jones Yvonne M
Purchase Details
Closed on
Feb 18, 2011
Sold by
Olson Raymond M
Bought by
Olson Raymond M and Raymond M Olson 2011 Revocable
Create a Home Valuation Report for This Property
The Home Valuation Report is an in-depth analysis detailing your home's value as well as a comparison with similar homes in the area
Purchase History
| Date | Buyer | Sale Price | Title Company |
|---|---|---|---|
| Jones Douglas Ferrell | -- | Pacific Coast Title | |
| Jones Douglas Ferrell | -- | None Available | |
| Jones E Ferrell | $95,000 | First American Title Company | |
| Olson Raymond M | -- | None Available |
Source: Public Records
Mortgage History
| Date | Status | Borrower | Loan Amount |
|---|---|---|---|
| Previous Owner | Jones Douglas Ferrell | $60,000 |
Source: Public Records
Tax History
| Year | Tax Paid | Tax Assessment Tax Assessment Total Assessment is a certain percentage of the fair market value that is determined by local assessors to be the total taxable value of land and additions on the property. | Land | Improvement |
|---|---|---|---|---|
| 2025 | $1,283 | $119,314 | $62,796 | $56,518 |
| 2024 | $1,260 | $116,975 | $61,565 | $55,410 |
| 2023 | $1,258 | $114,682 | $60,358 | $54,324 |
| 2022 | $1,237 | $112,434 | $59,175 | $53,259 |
| 2021 | $1,224 | $110,230 | $58,015 | $52,215 |
| 2020 | $1,215 | $109,101 | $57,421 | $51,680 |
| 2019 | $1,195 | $106,963 | $56,296 | $50,667 |
| 2018 | $1,194 | $104,867 | $55,193 | $49,674 |
| 2017 | $1,166 | $102,811 | $54,111 | $48,700 |
| 2016 | $1,089 | $100,796 | $53,050 | $47,746 |
| 2015 | $1,079 | $99,283 | $52,254 | $47,029 |
| 2014 | $1,069 | $97,339 | $51,231 | $46,108 |
Source: Public Records
Map
Nearby Homes
- 1550 E Marshall St
- 1910 East Ave
- 2521 East Ave
- 1598 East Ave
- 1438 Cahill Ave
- 1705 Larkspur Place
- 2500 Mira Flores Dr
- 145 N Daubenberger Rd
- 401 Bothun Rd
- 411 Bothun Rd
- 1325 Forest Dr
- 716 N Daubenberger Rd
- 1109 Alpha Rd
- 951 E Main St
- 1425 Forest Dr
- 1030 Alpha Rd
- 1460 E Hawkeye Ave
- 1701 Sylvia Ct
- 528 S Minaret Ave
- 1730 Sylvia Ct
- 1980 Charles Place
- 431 N Johnson Rd
- 1930 Charles Place
- 2005 Zinfandel Ln
- 2000 Zinfandel Ln
- 1995 Charles Place
- 1945 E Marshall St
- 1975 Charles Place
- 401 N Johnson Rd
- 2020 Zinfandel Ln
- 2025 Zinfandel Ln
- 1955 Charles Place
- 2000 Carrigan St
- 1900 Charles Place
- 1943 E Marshall St
- 1925 Charles Place
- 2040 Zinfandel Ln
- 2045 Zinfandel Ln
- 2020 Carrigan St
- 2025 E Marshall St
Your Personal Tour Guide
Ask me questions while you tour the home.