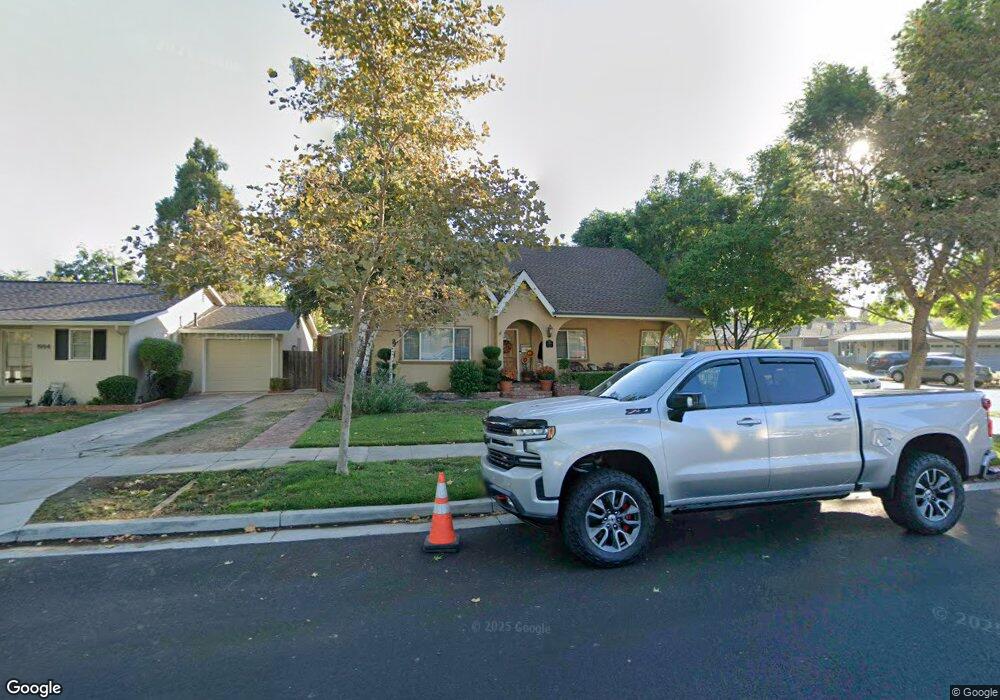
1998 Johnston Ave San Jose, CA 95125
Willow Glen NeighborhoodEstimated Value: $1,940,000 - $2,566,000
4
Beds
3
Baths
1,167
Sq Ft
$1,801/Sq Ft
Est. Value
About This Home
This home is located at 1998 Johnston Ave, San Jose, CA 95125 and is currently estimated at $2,101,725, approximately $1,800 per square foot. 1998 Johnston Ave is a home located in Santa Clara County with nearby schools including Booksin Elementary, Willow Glen Middle, and Willow Glen High School.
Ownership History
Date
Name
Owned For
Owner Type
Purchase Details
Closed on
Sep 9, 2020
Sold by
Dela Rocha Xavier and Dela Brenda L
Bought by
Xavier And Brenda De La Rocha Revocable Trust and De La Rocha
Current Estimated Value
Home Financials for this Owner
Home Financials are based on the most recent Mortgage that was taken out on this home.
Original Mortgage
$510,400
Outstanding Balance
$452,946
Interest Rate
2.9%
Mortgage Type
New Conventional
Estimated Equity
$1,648,779
Purchase Details
Closed on
Jun 14, 2018
Sold by
Delarocha Xavier De and De La Rocha Brenda L
Bought by
Delarocha Xavier and Delarocha Brenda
Purchase Details
Closed on
Dec 6, 1995
Sold by
Spencer Errol Craig
Bought by
Delarocha Xavier and Delarocha Brenda Lee
Home Financials for this Owner
Home Financials are based on the most recent Mortgage that was taken out on this home.
Original Mortgage
$123,000
Interest Rate
7.47%
Create a Home Valuation Report for This Property
The Home Valuation Report is an in-depth analysis detailing your home's value as well as a comparison with similar homes in the area
Home Values in the Area
Average Home Value in this Area
Purchase History
| Date | Buyer | Sale Price | Title Company |
|---|---|---|---|
| Xavier And Brenda De La Rocha Revocable Trust | -- | Wfg National Title | |
| Dela Rocha Xavier | -- | Wfg National Title | |
| Delarocha Xavier | -- | None Available | |
| Delarocha Xavier | $164,000 | Santa Clara Land Title Co |
Source: Public Records
Mortgage History
| Date | Status | Borrower | Loan Amount |
|---|---|---|---|
| Open | Dela Rocha Xavier | $510,400 | |
| Previous Owner | Delarocha Xavier | $123,000 | |
| Closed | Delarocha Xavier | $24,600 |
Source: Public Records
Tax History Compared to Growth
Tax History
| Year | Tax Paid | Tax Assessment Tax Assessment Total Assessment is a certain percentage of the fair market value that is determined by local assessors to be the total taxable value of land and additions on the property. | Land | Improvement |
|---|---|---|---|---|
| 2025 | $5,956 | $395,377 | $245,854 | $149,523 |
| 2024 | $5,956 | $387,626 | $241,034 | $146,592 |
| 2023 | $5,813 | $380,026 | $236,308 | $143,718 |
| 2022 | $5,762 | $372,575 | $231,675 | $140,900 |
| 2021 | $5,604 | $365,271 | $227,133 | $138,138 |
| 2020 | $5,445 | $361,527 | $224,805 | $136,722 |
| 2019 | $5,311 | $354,440 | $220,398 | $134,042 |
| 2018 | $5,242 | $347,491 | $216,077 | $131,414 |
| 2017 | $5,189 | $340,679 | $211,841 | $128,838 |
| 2016 | $5,035 | $334,000 | $207,688 | $126,312 |
| 2015 | $4,990 | $328,984 | $204,569 | $124,415 |
| 2014 | $4,559 | $322,540 | $200,562 | $121,978 |
Source: Public Records
Map
Nearby Homes
- 2114 Ardis Dr
- 2059 Jonathan Ave
- 2070 Almaden Rd
- 888 Pine Ave
- 1768 Harmil Way
- 2128 Canoas Garden Ave Unit D
- 1853 Almaden Rd Unit 405
- 1853 Almaden Rd Unit 209
- 1853 Almaden Rd Unit 504
- 1853 Almaden Rd Unit 305
- 1853 Almaden Rd Unit 108
- 1853 Almaden Rd Unit 214
- 2150 Almaden Rd Unit 103
- 2150 Almaden Rd
- 2150 Almaden Rd Unit 147
- 2206 Almaden Rd Unit B
- B1 Plan at The Almaden Terrace Condominiums
- B3 Plan at The Almaden Terrace Condominiums
- A1 Plan at The Almaden Terrace Condominiums
- C2 Plan at The Almaden Terrace Condominiums
- 1994 Johnston Ave
- 1982 Johnston Ave
- 876 Creek Dr Unit DRY
- 894 Creek Dr Unit DRY
- 846 Creek Dr
- 850 Creek Dr Unit DRY
- 811 Creek Dr
- 1991 Bird Ave
- 1972 Johnston Ave
- 830 Creek Dr
- 1981 Bird Ave
- 824 Creek Dr
- 2022 Johnston Ave
- 826 Creek Dr Unit DRY
- 2001 Johnston Ave
- 1989 Johnston Ave
- 1973 Bird Ave
- 2009 Johnston Ave
- 812 Creek Dr
- 1981 Johnston Ave