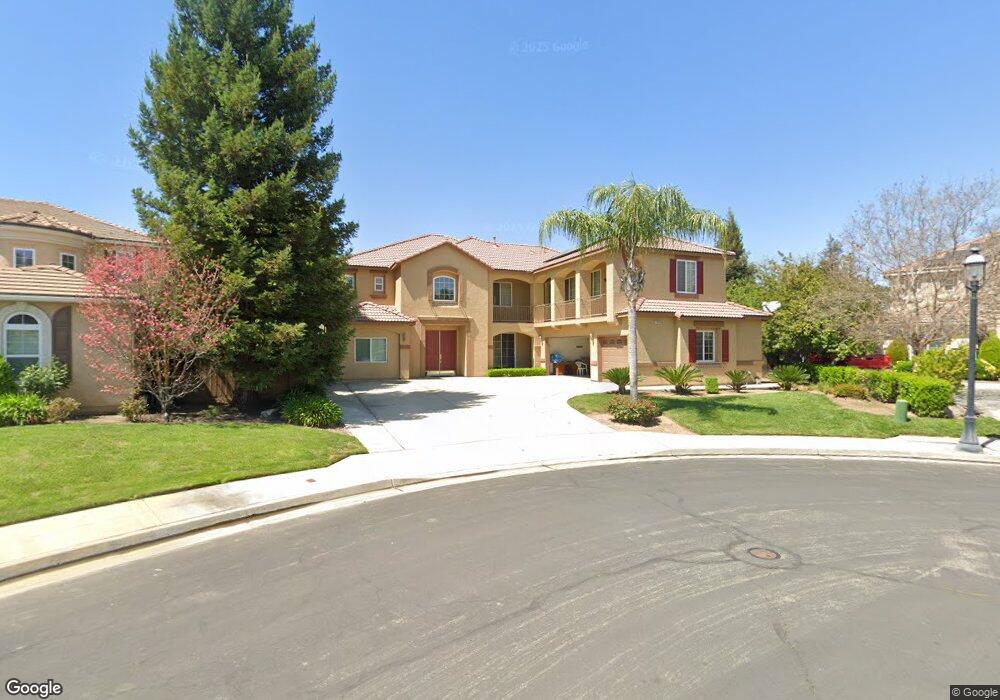
1998 N Filbert Ave Clovis, CA 93619
Estimated Value: $857,000 - $952,524
6
Beds
4
Baths
4,789
Sq Ft
$186/Sq Ft
Est. Value
About This Home
This home is located at 1998 N Filbert Ave, Clovis, CA 93619 and is currently estimated at $892,175, approximately $186 per square foot. 1998 N Filbert Ave is a home located in Fresno County with nearby schools including Dry Creek Elementary School, Alta Sierra Intermediate School, and Buchanan High School.
Ownership History
Date
Name
Owned For
Owner Type
Purchase Details
Closed on
Dec 13, 2021
Sold by
Singh Kuldip and Kaur Karampal
Bought by
Singh Kuldip and Kaur Karampal
Current Estimated Value
Purchase Details
Closed on
Dec 29, 2003
Sold by
Kaur Ramandeep
Bought by
Singh Jasdeep
Home Financials for this Owner
Home Financials are based on the most recent Mortgage that was taken out on this home.
Original Mortgage
$377,500
Outstanding Balance
$146,847
Interest Rate
3.5%
Mortgage Type
Purchase Money Mortgage
Estimated Equity
$745,328
Purchase Details
Closed on
May 20, 2002
Sold by
Granville Homes Inc
Bought by
Singh Kuldip and Kaur Karampal
Home Financials for this Owner
Home Financials are based on the most recent Mortgage that was taken out on this home.
Original Mortgage
$300,000
Interest Rate
6.12%
Create a Home Valuation Report for This Property
The Home Valuation Report is an in-depth analysis detailing your home's value as well as a comparison with similar homes in the area
Home Values in the Area
Average Home Value in this Area
Purchase History
| Date | Buyer | Sale Price | Title Company |
|---|---|---|---|
| Singh Kuldip | -- | None Available | |
| Singh Jasdeep | -- | Financial Title Company | |
| Singh Kuldip | -- | Financial Title Company | |
| Singh Kuldip | $397,500 | Financial Title Company |
Source: Public Records
Mortgage History
| Date | Status | Borrower | Loan Amount |
|---|---|---|---|
| Open | Singh Kuldip | $377,500 | |
| Previous Owner | Singh Kuldip | $300,000 | |
| Closed | Singh Kuldip | $57,669 |
Source: Public Records
Tax History
| Year | Tax Paid | Tax Assessment Tax Assessment Total Assessment is a certain percentage of the fair market value that is determined by local assessors to be the total taxable value of land and additions on the property. | Land | Improvement |
|---|---|---|---|---|
| 2025 | $7,201 | $585,438 | $86,890 | $498,548 |
| 2023 | $6,916 | $562,707 | $83,517 | $479,190 |
| 2022 | $6,818 | $551,675 | $81,880 | $469,795 |
| 2021 | $6,613 | $540,859 | $80,275 | $460,584 |
| 2020 | $6,648 | $535,314 | $79,452 | $455,862 |
| 2019 | $6,524 | $524,819 | $77,895 | $446,924 |
| 2018 | $6,388 | $514,529 | $76,368 | $438,161 |
| 2017 | $6,284 | $504,441 | $74,871 | $429,570 |
| 2016 | $6,073 | $494,551 | $73,403 | $421,148 |
| 2015 | $5,965 | $487,123 | $72,301 | $414,822 |
| 2014 | $6,072 | $477,582 | $70,885 | $406,697 |
Source: Public Records
Map
Nearby Homes
- 2319 Prescott Ave
- 9226 N Fowler Ave
- 1731 N Hanson Ave
- 1684 Heirloom Ave
- 1734 N Park Ave
- 1685 Heirloom Ave
- 1675 Heirloom Ave
- 1655 Heirloom Ave
- 5211 E Shepherd Ave
- 2023 N Wagon Ln
- 2029 N Wagon Ln
- 2035 N Wagon Ln
- 2041 N Wagon Ln
- 2047 N Wagon Ln
- 2053 N Wagon Ln
- 2059 N Wagon Ln
- 2065 N Wagon Ln
- 2071 N Wagon Ln
- 2077 N Wagon Ln
- 2083 N Wagon Ln
- 2201 Serena Ave
- 1978 N Filbert Ave
- 2211 Serena Ave
- 1958 N Filbert Ave
- 1983 N Douglas Ave
- 2210 Serena Ave
- 6120 E Shepherd Ave
- 1963 N Douglas Ave
- 2191 Serena Ave
- 2221 Serena Ave
- 1938 N Filbert Ave
- 1943 N Douglas Ave
- 2220 Serena Ave
- 1933 N Filbert Ave
- 2231 Serena Ave
- 1918 N Filbert Ave
- 2181 Serena Ave
- 2230 Serena Ave
- 2180 Serena Ave
- 1913 N Filbert Ave
Your Personal Tour Guide
Ask me questions while you tour the home.