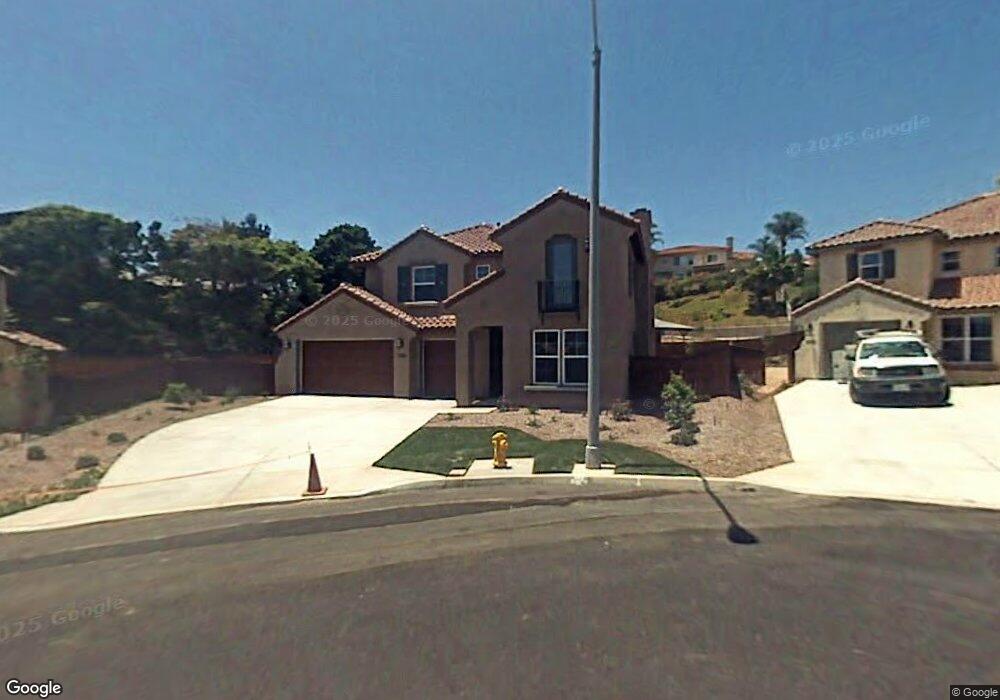
1999 Chopin Way Oceanside, CA 92054
Fire Mountain NeighborhoodEstimated Value: $1,695,000 - $2,016,000
5
Beds
4
Baths
3,182
Sq Ft
$571/Sq Ft
Est. Value
About This Home
This home is located at 1999 Chopin Way, Oceanside, CA 92054 and is currently estimated at $1,816,415, approximately $570 per square foot. 1999 Chopin Way is a home located in San Diego County with nearby schools including Palmquist Elementary School, Lincoln Middle School, and Oceanside High School.
Ownership History
Date
Name
Owned For
Owner Type
Purchase Details
Closed on
Jun 28, 2017
Sold by
Hillen Noah G
Bought by
Borough William Charles and Borough Sheryl Diane Carlin
Current Estimated Value
Home Financials for this Owner
Home Financials are based on the most recent Mortgage that was taken out on this home.
Original Mortgage
$609,000
Outstanding Balance
$506,254
Interest Rate
3.91%
Mortgage Type
New Conventional
Estimated Equity
$1,310,161
Purchase Details
Closed on
Jan 23, 2008
Sold by
Benner Brian and Benner Jennifer
Bought by
Benner Brian Scott and Benner Jennifer Kelly
Purchase Details
Closed on
Mar 12, 2007
Sold by
Nobel Homes
Bought by
Benner Brian and Benner Jennifer
Home Financials for this Owner
Home Financials are based on the most recent Mortgage that was taken out on this home.
Original Mortgage
$614,250
Interest Rate
6.66%
Mortgage Type
Negative Amortization
Create a Home Valuation Report for This Property
The Home Valuation Report is an in-depth analysis detailing your home's value as well as a comparison with similar homes in the area
Home Values in the Area
Average Home Value in this Area
Purchase History
| Date | Buyer | Sale Price | Title Company |
|---|---|---|---|
| Borough William Charles | $812,000 | Fidelity Natl Title San Dieg | |
| Benner Brian Scott | -- | None Available | |
| Benner Brian | $819,000 | Fidelity National Title Co |
Source: Public Records
Mortgage History
| Date | Status | Borrower | Loan Amount |
|---|---|---|---|
| Open | Borough William Charles | $609,000 | |
| Previous Owner | Benner Brian | $614,250 |
Source: Public Records
Tax History Compared to Growth
Tax History
| Year | Tax Paid | Tax Assessment Tax Assessment Total Assessment is a certain percentage of the fair market value that is determined by local assessors to be the total taxable value of land and additions on the property. | Land | Improvement |
|---|---|---|---|---|
| 2025 | $10,179 | $923,910 | $512,020 | $411,890 |
| 2024 | $10,179 | $905,795 | $501,981 | $403,814 |
| 2023 | $9,866 | $888,036 | $492,139 | $395,897 |
| 2022 | $9,717 | $870,625 | $482,490 | $388,135 |
| 2021 | $9,755 | $853,555 | $473,030 | $380,525 |
| 2020 | $9,453 | $844,804 | $468,180 | $376,624 |
| 2019 | $9,178 | $828,240 | $459,000 | $369,240 |
| 2018 | $9,081 | $812,000 | $450,000 | $362,000 |
| 2017 | $10,372 | $926,894 | $434,588 | $492,306 |
| 2016 | $8,017 | $725,000 | $307,000 | $418,000 |
| 2015 | $7,413 | $680,000 | $288,000 | $392,000 |
| 2014 | $7,267 | $680,000 | $288,000 | $392,000 |
Source: Public Records
Map
Nearby Homes
- 0 Ivy Rd Unit NDP2511545
- 2275 Ivy Rd
- 2245 Ivy Rd
- 0 Fire Mountain Dr Unit NDP2511544
- 2309 Loker Way
- 1331 Cornish Dr
- 2125 Valley Rd
- 1427 Avocado Rd
- 2336 Hosp Way Unit 314
- 2360 Hosp Way Unit 331
- 2238 Oceanview Rd
- 0 Oceanview Rd Unit NDP2504901
- 2225 David Place
- Apn: 149-340-16-00
- 1611 Whaley St
- 1541 Lauralynn Place
- 2517 Via Astuto Unit 1
- 2062 Avenue of The Trees
- 1519 Kurtz St
- 3030 Oceanside Blvd Unit 56
- 1995 Chopin Way
- 2003 Chopin Way
- 2450 Ivy Rd
- 1991 Chopin Way
- 1990 Chopin Way
- 1972 Andrews Ct
- 1960 Andrews Ct
- 2398 Ivy Rd
- 2007 Chopin Way
- 1948 Andrews Ct
- 2380 Ivy Rd
- 1984 Andrews Ct
- 1994 Chopin Way
- 2011 Chopin Way
- 2382 Ivy Rd # A
- 1987 Catamaran Way
- 1985 Catamaran Way
- 2382 Ivy Road A
- 2382 Ivy Rd Unit C
- 2382 Ivy Rd Unit A