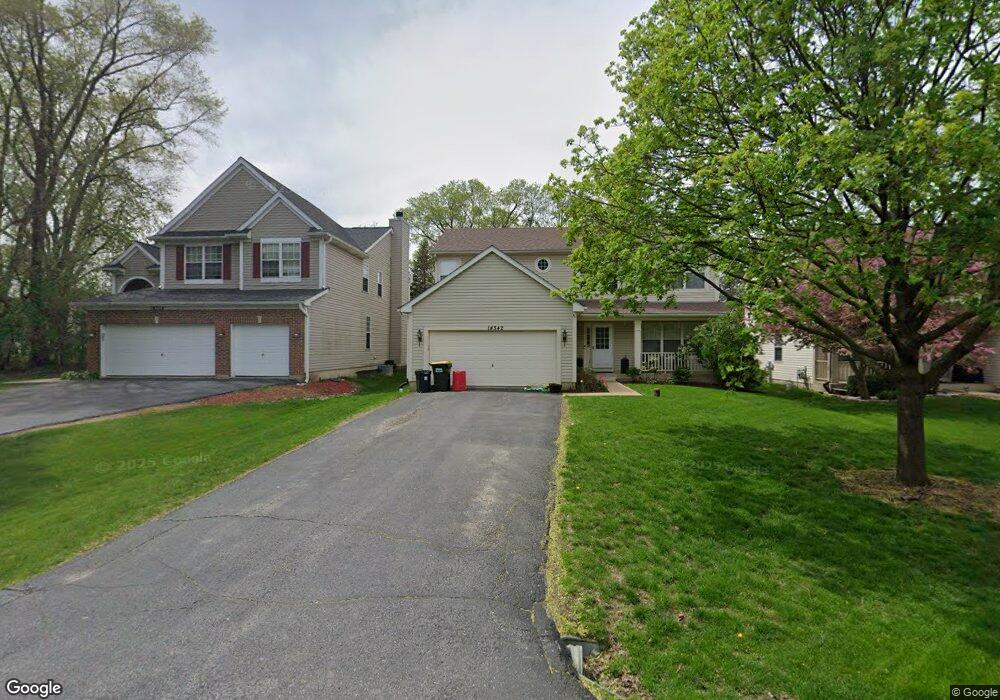
1N342 Morse St Carol Stream, IL 60188
South Carol Stream NeighborhoodEstimated Value: $490,361 - $573,000
4
Beds
3
Baths
2,145
Sq Ft
$248/Sq Ft
Est. Value
About This Home
This home is located at 1N342 Morse St, Carol Stream, IL 60188 and is currently estimated at $531,340, approximately $247 per square foot. 1N342 Morse St is a home located in DuPage County with nearby schools including Washington Elementary School, Monroe Middle School, and Wheaton North High School.
Ownership History
Date
Name
Owned For
Owner Type
Purchase Details
Closed on
Dec 21, 1999
Sold by
Wheels Up Ltd Partnership
Bought by
Rai Suman Roop
Current Estimated Value
Home Financials for this Owner
Home Financials are based on the most recent Mortgage that was taken out on this home.
Original Mortgage
$130,000
Outstanding Balance
$42,262
Interest Rate
8.37%
Estimated Equity
$489,078
Create a Home Valuation Report for This Property
The Home Valuation Report is an in-depth analysis detailing your home's value as well as a comparison with similar homes in the area
Home Values in the Area
Average Home Value in this Area
Purchase History
| Date | Buyer | Sale Price | Title Company |
|---|---|---|---|
| Rai Suman Roop | $226,500 | -- |
Source: Public Records
Mortgage History
| Date | Status | Borrower | Loan Amount |
|---|---|---|---|
| Open | Rai Suman Roop | $130,000 |
Source: Public Records
Tax History Compared to Growth
Tax History
| Year | Tax Paid | Tax Assessment Tax Assessment Total Assessment is a certain percentage of the fair market value that is determined by local assessors to be the total taxable value of land and additions on the property. | Land | Improvement |
|---|---|---|---|---|
| 2024 | $7,840 | $136,093 | $15,090 | $121,003 |
| 2023 | $7,999 | $125,270 | $13,890 | $111,380 |
| 2022 | $7,853 | $118,380 | $13,120 | $105,260 |
| 2021 | $7,853 | $115,570 | $12,810 | $102,760 |
| 2020 | $7,501 | $114,490 | $12,690 | $101,800 |
| 2019 | $7,313 | $111,460 | $12,350 | $99,110 |
| 2018 | $6,936 | $104,740 | $11,640 | $93,100 |
| 2017 | $6,805 | $100,880 | $11,210 | $89,670 |
| 2016 | $6,700 | $96,850 | $10,760 | $86,090 |
| 2015 | $6,635 | $92,390 | $10,260 | $82,130 |
| 2014 | $6,883 | $93,970 | $10,710 | $83,260 |
| 2013 | $6,647 | $94,250 | $10,740 | $83,510 |
Source: Public Records
Map
Nearby Homes
- 25W275 Doris Ave
- 25W277 Doris Ave
- 25W361 Doris Ave
- 0 Ellis Ave
- 1426 Preserve Dr Unit 30
- 1035 Quarry Ct Unit 9
- 0N649 Knollwood Dr
- N675 Herrick Dr
- 0N510 Gary Ave
- 26W080 Wood Lark Dr
- 631 Belmont Ln
- 628 Belmont Ln
- 27W130 W Street Charles Rd
- Lot 2 W Street Charles Rd
- 26W199 Klein Creek Dr
- 1902 N Washington St
- 299 Bennett Dr
- 26W185 Meadowview Ct
- 229 Shawnee Dr
- 206 Yuma Ln
- 1N352 Morse St
- 1N338 Morse St
- 1N338 Morse St
- 1N320 Morse St
- 1N362 Morse St
- 1N341 Farwell St
- 1N335 Farwell St
- 1N349 Farwell St
- 1N355 Farwell St
- 1N329 Farwell St
- 1N353 Morse St
- 1N335 Morse St
- 1n319 Farwell St
- 1N311 Farwell St
- 1N371 Farwell St
- 1N357 Morse St
- 25W211 Doris Ave
- 25W219 Doris Ave
- 1N306 Morse St
- 1N375 Farwell St