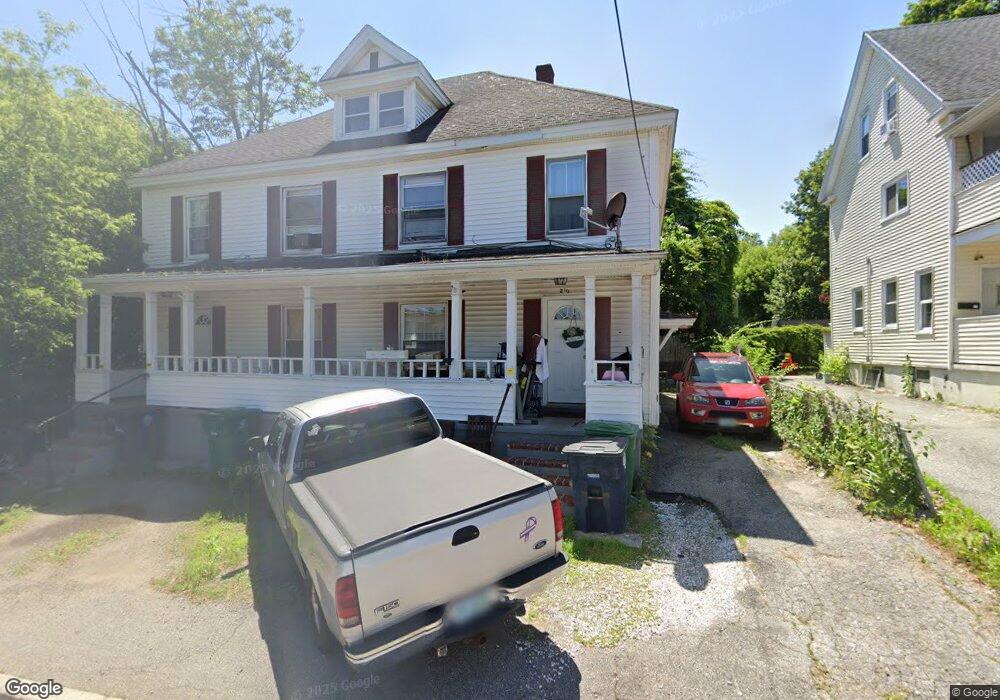
2 1/2 Kendrick St Nashua, NH 03064
North End Nashua NeighborhoodEstimated Value: $452,599 - $630,000
4
Beds
2
Baths
2,480
Sq Ft
$216/Sq Ft
Est. Value
About This Home
This home is located at 2 1/2 Kendrick St, Nashua, NH 03064 and is currently estimated at $535,650, approximately $215 per square foot. 2 1/2 Kendrick St is a home located in Hillsborough County with nearby schools including Mount Pleasant Elementary School, Pennichuck Middle School, and Nashua High School North.
Ownership History
Date
Name
Owned For
Owner Type
Purchase Details
Closed on
Nov 2, 2009
Sold by
Mcgrath Joyce G
Bought by
Ferguson Andrew J
Current Estimated Value
Home Financials for this Owner
Home Financials are based on the most recent Mortgage that was taken out on this home.
Original Mortgage
$202,268
Outstanding Balance
$131,943
Interest Rate
5.06%
Mortgage Type
Purchase Money Mortgage
Estimated Equity
$403,707
Create a Home Valuation Report for This Property
The Home Valuation Report is an in-depth analysis detailing your home's value as well as a comparison with similar homes in the area
Home Values in the Area
Average Home Value in this Area
Purchase History
| Date | Buyer | Sale Price | Title Company |
|---|---|---|---|
| Ferguson Andrew J | $206,000 | -- |
Source: Public Records
Mortgage History
| Date | Status | Borrower | Loan Amount |
|---|---|---|---|
| Open | Ferguson Andrew J | $202,268 | |
| Previous Owner | Ferguson Andrew J | $210,000 | |
| Previous Owner | Ferguson Andrew J | $60,000 |
Source: Public Records
Tax History Compared to Growth
Tax History
| Year | Tax Paid | Tax Assessment Tax Assessment Total Assessment is a certain percentage of the fair market value that is determined by local assessors to be the total taxable value of land and additions on the property. | Land | Improvement |
|---|---|---|---|---|
| 2024 | $7,357 | $462,700 | $105,900 | $356,800 |
| 2023 | $7,204 | $395,200 | $84,700 | $310,500 |
| 2022 | $7,141 | $395,200 | $84,700 | $310,500 |
| 2021 | $5,937 | $255,700 | $56,500 | $199,200 |
| 2020 | $5,729 | $253,400 | $56,500 | $196,900 |
| 2019 | $5,514 | $253,400 | $56,500 | $196,900 |
| 2018 | $5,375 | $253,400 | $56,500 | $196,900 |
| 2017 | $0 | $244,100 | $70,300 | $173,800 |
| 2016 | $6,120 | $244,100 | $70,300 | $173,800 |
| 2015 | $5,988 | $244,100 | $70,300 | $173,800 |
| 2014 | $5,837 | $242,700 | $70,300 | $172,400 |
Source: Public Records
Map
Nearby Homes
- 46 Perham St Unit 214
- 13 Sapphire Ln
- 15 Atherton Ave
- 19 Atherton Ave
- 36-38 Courtland St
- 71 Concord St
- 11 Charles St
- 4 Reservoir St
- 21 Edson St
- 18 Harbor Ave Unit 208
- 5 Mulberry St
- 38 Central St
- 0 Baldwin St
- 13 Mulvanity St
- 19 Bartlett Ave
- 4 Chase St
- 31 Juliana Ave
- 31 Juliana Ave Unit 4
- 30 Ledge St
- 73 Berkeley St
- 2 Kendrick St
- 2 Kendrick St Unit 1
- 22 1/2 Kendrick St
- 44 1/2 Kendrick St
- 4 Kendrick St
- 57 Kendrick St
- 46 Lock St
- 40 Lock St Unit 42
- 44 Lock St
- 48 Lock St
- 50 Lock St
- 6 Kendrick St Unit 6A
- 8 Kendrick St
- 9 Dow St
- 9 Kendrick St
- 36 Cross St
- 47 Lock St Unit 190
- 41 Lock St
- 36 Lock St Unit 38
- 38 Cross St Unit 40