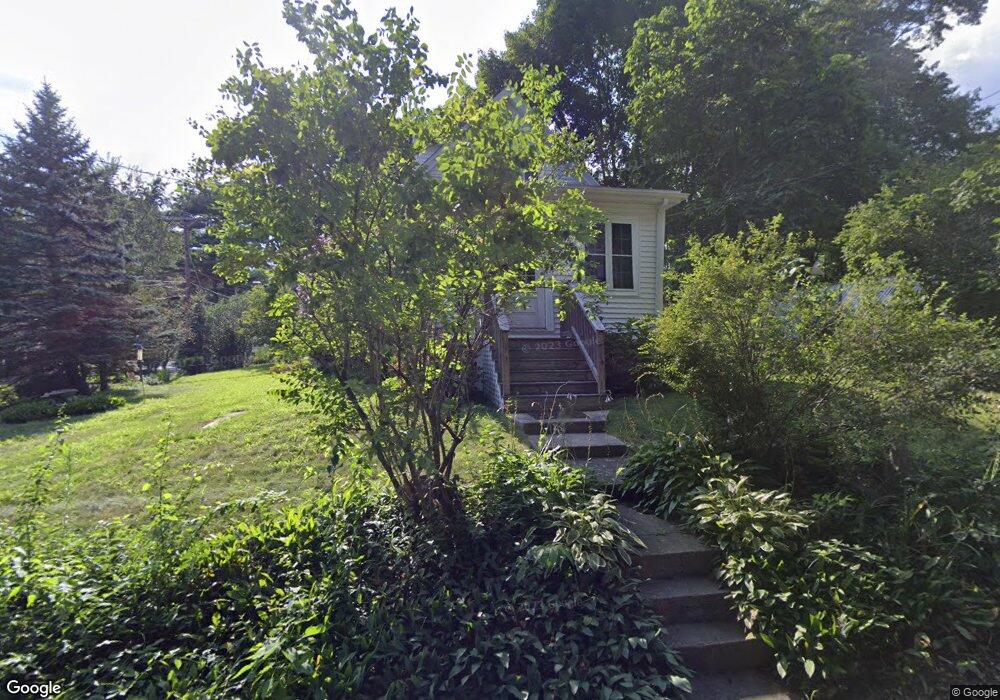
2 Allen St Andover, MA 01810
Shawsheen Heights NeighborhoodEstimated Value: $582,000 - $745,000
2
Beds
2
Baths
1,147
Sq Ft
$594/Sq Ft
Est. Value
About This Home
This home is located at 2 Allen St, Andover, MA 01810 and is currently estimated at $681,891, approximately $594 per square foot. 2 Allen St is a home located in Essex County with nearby schools including West Elementary School, Andover West Middle School, and Andover High School.
Ownership History
Date
Name
Owned For
Owner Type
Purchase Details
Closed on
Feb 18, 2005
Sold by
Hill John S and Hill Heather
Bought by
Bedrosian Sandra Lynn
Current Estimated Value
Home Financials for this Owner
Home Financials are based on the most recent Mortgage that was taken out on this home.
Original Mortgage
$36,500
Outstanding Balance
$18,465
Interest Rate
5.78%
Mortgage Type
Purchase Money Mortgage
Estimated Equity
$663,426
Purchase Details
Closed on
Aug 4, 2004
Sold by
Samataro Shirley J Est and Perkins
Bought by
Hill John S and Hill Heather
Home Financials for this Owner
Home Financials are based on the most recent Mortgage that was taken out on this home.
Original Mortgage
$256,500
Interest Rate
6.2%
Mortgage Type
Purchase Money Mortgage
Create a Home Valuation Report for This Property
The Home Valuation Report is an in-depth analysis detailing your home's value as well as a comparison with similar homes in the area
Home Values in the Area
Average Home Value in this Area
Purchase History
| Date | Buyer | Sale Price | Title Company |
|---|---|---|---|
| Bedrosian Sandra Lynn | $365,000 | -- | |
| Bedrosian Sandra Lynn | $365,000 | -- | |
| Hill John S | $270,000 | -- | |
| Hill John S | $270,000 | -- |
Source: Public Records
Mortgage History
| Date | Status | Borrower | Loan Amount |
|---|---|---|---|
| Open | Bedrosian Sandra Lynn | $36,500 | |
| Closed | Hill John S | $36,500 | |
| Previous Owner | Hill John S | $256,500 |
Source: Public Records
Tax History Compared to Growth
Tax History
| Year | Tax Paid | Tax Assessment Tax Assessment Total Assessment is a certain percentage of the fair market value that is determined by local assessors to be the total taxable value of land and additions on the property. | Land | Improvement |
|---|---|---|---|---|
| 2024 | $7,463 | $579,400 | $336,300 | $243,100 |
| 2023 | $7,140 | $522,700 | $303,000 | $219,700 |
| 2022 | $6,774 | $464,000 | $263,400 | $200,600 |
| 2021 | $6,481 | $423,900 | $239,400 | $184,500 |
| 2020 | $6,213 | $413,900 | $233,400 | $180,500 |
| 2019 | $6,146 | $402,500 | $226,500 | $176,000 |
| 2018 | $5,943 | $380,000 | $217,900 | $162,100 |
| 2017 | $5,682 | $374,300 | $213,600 | $160,700 |
| 2016 | $5,547 | $374,300 | $213,600 | $160,700 |
| 2015 | $5,346 | $357,100 | $205,400 | $151,700 |
Source: Public Records
Map
Nearby Homes
- 10 Martingale Ln Unit 10
- 6 Windsor St
- 437 N Main St Unit C
- 102 Weare St
- 24 York St
- 21 Clubview Dr Unit 21
- 34 Leeds Terrace
- 2 Haskell Rd
- 5 Marc Ln
- 5 Lafayette Ave
- 5 W Kenneth St
- 24 Inman St Unit 32
- 33 Jefferson St
- 11 W Hawley St
- 42 Beresford St
- 25 Clubview Dr Unit 25
- 13 Clubview Dr Unit 13
- 96 Beacon St
- 5 Castle Heights Rd
- 38 Lincoln Cir E