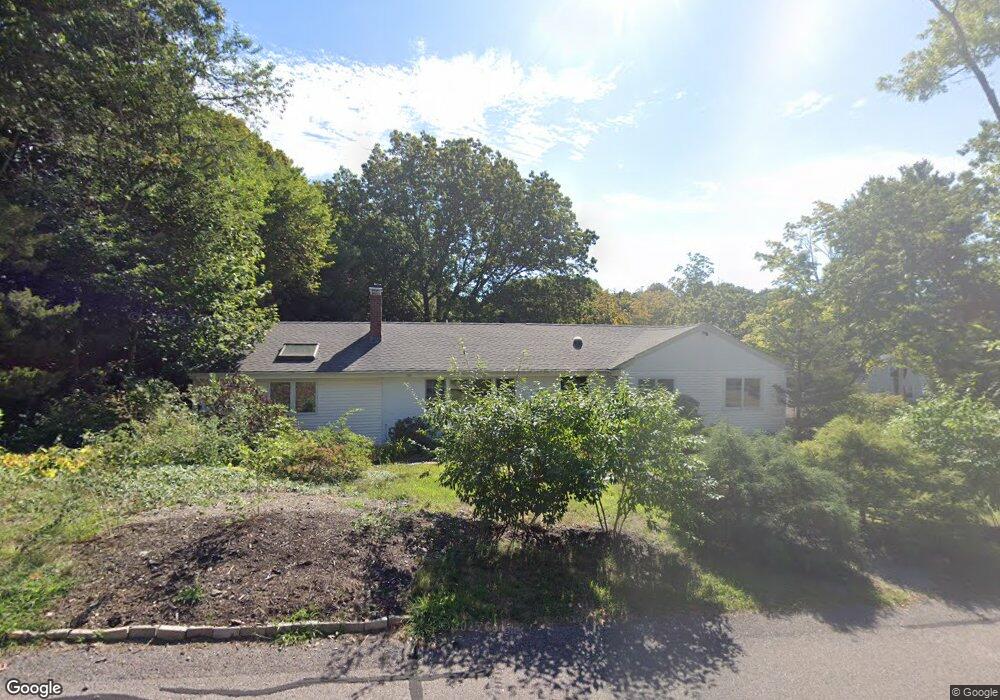
2 Autumn Cir Hingham, MA 02043
Estimated Value: $1,160,339 - $1,367,000
4
Beds
3
Baths
2,346
Sq Ft
$551/Sq Ft
Est. Value
About This Home
This home is located at 2 Autumn Cir, Hingham, MA 02043 and is currently estimated at $1,293,085, approximately $551 per square foot. 2 Autumn Cir is a home located in Plymouth County with nearby schools including Plymouth River Elementary School, Hingham Middle School, and Hingham High School.
Ownership History
Date
Name
Owned For
Owner Type
Purchase Details
Closed on
May 31, 2007
Sold by
Ling Rt and Ling May Lee
Bought by
Ling Horace and Ling Vivian
Current Estimated Value
Home Financials for this Owner
Home Financials are based on the most recent Mortgage that was taken out on this home.
Original Mortgage
$417,000
Interest Rate
6.24%
Mortgage Type
Purchase Money Mortgage
Create a Home Valuation Report for This Property
The Home Valuation Report is an in-depth analysis detailing your home's value as well as a comparison with similar homes in the area
Purchase History
We collect this data history from publicly available records. To have your information removed, we recommend requesting removal directly through your county’s website.
| Date | Buyer | Sale Price | Title Company |
|---|---|---|---|
| Ling Horace | $700,000 | -- |
Source: Public Records
Mortgage History
We collect this data history from publicly available records. To have your information removed, we recommend requesting removal directly through your county’s website.
| Date | Status | Borrower | Loan Amount |
|---|---|---|---|
| Open | Ling Horace | $405,000 | |
| Closed | Ling Horace | $414,000 | |
| Closed | Ling Horace | $417,000 | |
| Previous Owner | Ling Horace | $165,000 |
Source: Public Records
Tax History
| Year | Tax Paid | Tax Assessment Tax Assessment Total Assessment is a certain percentage of the fair market value that is determined by local assessors to be the total taxable value of land and additions on the property. | Land | Improvement |
|---|---|---|---|---|
| 2025 | $9,673 | $904,900 | $419,200 | $485,700 |
| 2024 | $9,455 | $871,400 | $419,200 | $452,200 |
| 2023 | $8,610 | $861,000 | $419,200 | $441,800 |
| 2022 | $8,242 | $713,000 | $361,600 | $351,400 |
| 2021 | $8,133 | $689,200 | $361,600 | $327,600 |
| 2020 | $7,946 | $689,200 | $361,600 | $327,600 |
| 2019 | $89 | $673,100 | $361,600 | $311,500 |
| 2018 | $7,543 | $640,900 | $361,600 | $279,300 |
| 2017 | $90 | $611,000 | $349,300 | $261,700 |
| 2016 | $7,423 | $594,300 | $332,600 | $261,700 |
| 2015 | $7,370 | $588,200 | $316,600 | $271,600 |
Source: Public Records
Map
Nearby Homes
- 87 Ward St
- 21 French St
- 203 High St
- 47 Black Rock Dr
- 30 Manatee Rd
- 2 Black Rock Dr Unit 21
- 2 Black Rock Dr
- 5 Blackhorse Ln
- 1297 Pleasant St
- 1429 Pleasant St
- 117 Hobart St
- 156 Fort Hill St
- 59 Clubhouse Dr Unit 59
- 59 Clubhouse Dr
- 71 Clubhouse Dr
- 1 Brewer Way
- 10-12 Drew Ave
- 95 Black Rock Dr Unit 95
- 95 Black Rock Dr
- 485 East St
Your Personal Tour Guide
Ask me questions while you tour the home.