2 Chauncy Way Bourne, MA 2532
Pocasset NeighborhoodEstimated Value: $893,000 - $1,102,000
3
Beds
3
Baths
1,462
Sq Ft
$695/Sq Ft
Est. Value
About This Home
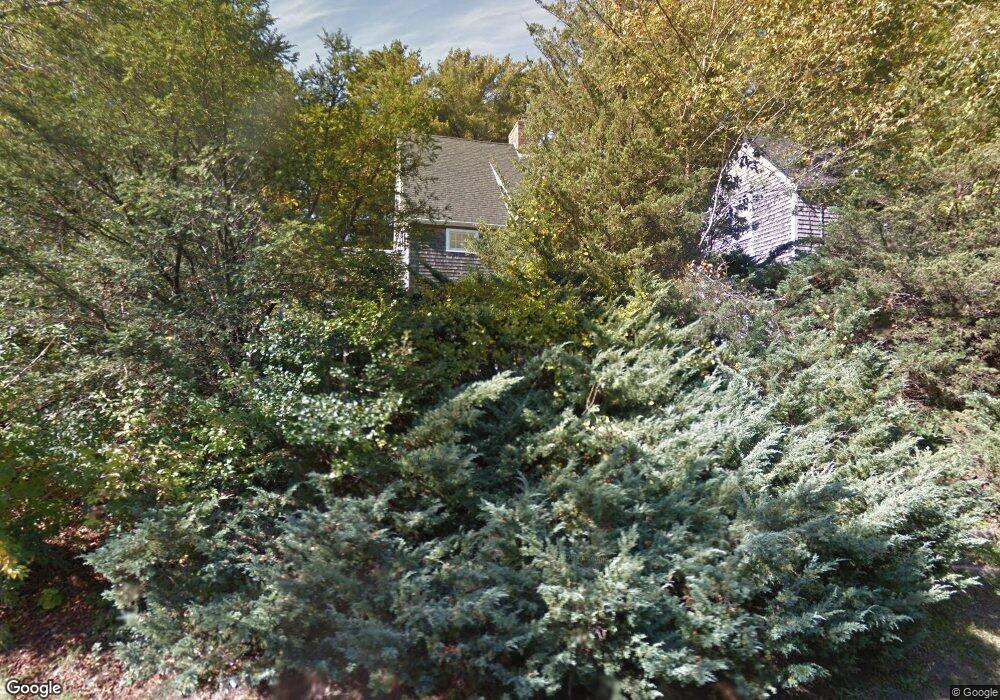
This home is located at 2 Chauncy Way, Bourne, MA 2532 and is currently estimated at $1,016,275, approximately $695 per square foot. 2 Chauncy Way is a home located in Barnstable County with nearby schools including Bourne High School, Cadence Academy Preschool - Bourne, and Heritage Christian Academy.
Ownership History
Date
Name
Owned For
Owner Type
Purchase Details
Closed on
Aug 19, 2005
Sold by
Griffin Catherine M and Griffin Robert A
Bought by
Galligan Maryfrances B and Galligan Natalie B
Current Estimated Value
Home Financials for this Owner
Home Financials are based on the most recent Mortgage that was taken out on this home.
Original Mortgage
$345,000
Interest Rate
5.66%
Mortgage Type
Purchase Money Mortgage
Create a Home Valuation Report for This Property
The Home Valuation Report is an in-depth analysis detailing your home's value as well as a comparison with similar homes in the area
Home Values in the Area
Average Home Value in this Area
Purchase History
| Date | Buyer | Sale Price | Title Company |
|---|---|---|---|
| Galligan Maryfrances B | $690,000 | -- | |
| Galligan Maryfrances B | $690,000 | -- |
Source: Public Records
Mortgage History
| Date | Status | Borrower | Loan Amount |
|---|---|---|---|
| Open | Galligan Maryfrances B | $326,000 | |
| Closed | Galligan Maryfrances B | $345,000 | |
| Previous Owner | Galligan Maryfrances B | $29,000 |
Source: Public Records
Tax History
| Year | Tax Paid | Tax Assessment Tax Assessment Total Assessment is a certain percentage of the fair market value that is determined by local assessors to be the total taxable value of land and additions on the property. | Land | Improvement |
|---|---|---|---|---|
| 2025 | $7,233 | $926,100 | $499,100 | $427,000 |
| 2024 | $7,073 | $881,900 | $475,300 | $406,600 |
| 2023 | $6,882 | $781,200 | $420,600 | $360,600 |
| 2022 | $6,656 | $659,700 | $372,200 | $287,500 |
| 2021 | $5,802 | $538,700 | $264,200 | $274,500 |
| 2020 | $5,621 | $523,400 | $261,700 | $261,700 |
| 2019 | $5,381 | $512,000 | $261,700 | $250,300 |
| 2018 | $5,172 | $490,700 | $249,300 | $241,400 |
| 2017 | $5,351 | $519,500 | $316,600 | $202,900 |
| 2016 | $5,186 | $510,400 | $316,600 | $193,800 |
| 2015 | $5,140 | $510,400 | $316,600 | $193,800 |
Source: Public Records
Map
Nearby Homes
- 48 Red Brook Harbor Rd
- 1234 Route 28a
- 1234 Route 28a
- 15 Oak Ave
- 16 Michael Rd
- 75 Winsor Rd
- 254 Barlows Landing Rd
- 709 County Rd
- 3 4th Ave
- 7 4th Ave
- 3 1st St
- 31 Baxendale Rd
- 14 Navajo Rd
- 289 Old Main Rd
- 566 Shore Rd
- 28 Nathan Ellis Hwy
- 14 Ryder Rd
- 209 Waterside Dr
- 393 N Falmouth Hwy Unit 8
- 20 Colony Ave
Your Personal Tour Guide
Ask me questions while you tour the home.