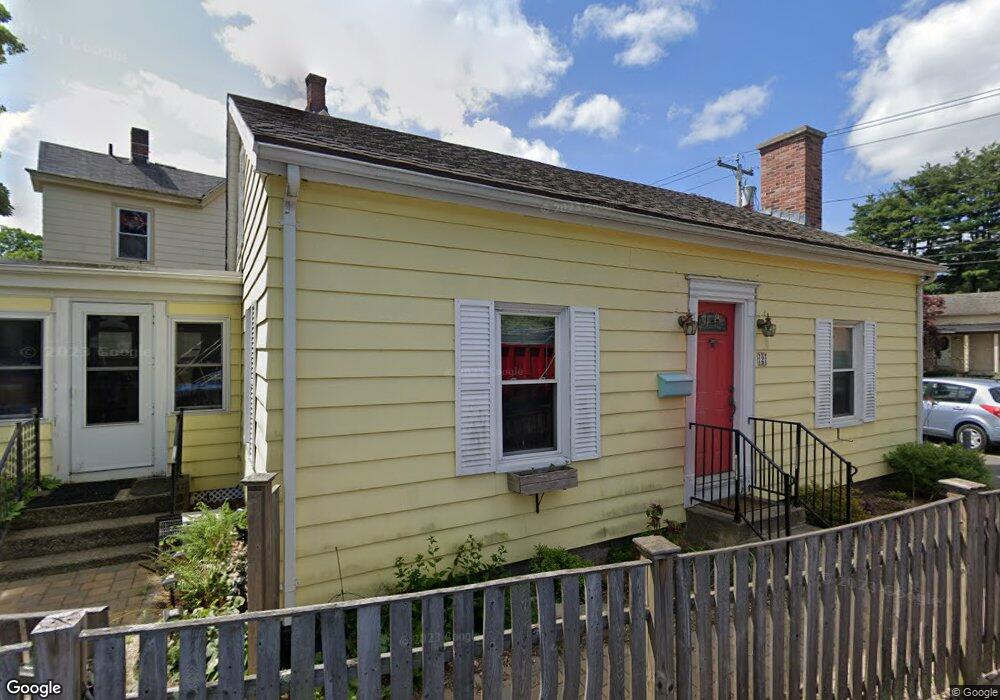
2 Cherry St Easthampton, MA 01027
Estimated Value: $332,626 - $410,000
3
Beds
2
Baths
1,248
Sq Ft
$297/Sq Ft
Est. Value
About This Home
This home is located at 2 Cherry St, Easthampton, MA 01027 and is currently estimated at $370,157, approximately $296 per square foot. 2 Cherry St is a home located in Hampshire County with nearby schools including Easthampton High School, Tri-County Schools, and New England Adolescent Research Institute.
Ownership History
Date
Name
Owned For
Owner Type
Purchase Details
Closed on
May 23, 2016
Sold by
Robertson David and Robertson Amanda
Bought by
Ray Evan L and Bixby Meredith S
Current Estimated Value
Home Financials for this Owner
Home Financials are based on the most recent Mortgage that was taken out on this home.
Original Mortgage
$142,000
Outstanding Balance
$112,783
Interest Rate
3.59%
Mortgage Type
New Conventional
Estimated Equity
$257,374
Purchase Details
Closed on
Apr 21, 2006
Sold by
Eliason Anita J and Shapiro Janina F
Bought by
Dorato Amanda N and Robertson David
Home Financials for this Owner
Home Financials are based on the most recent Mortgage that was taken out on this home.
Original Mortgage
$127,500
Interest Rate
6.37%
Mortgage Type
Purchase Money Mortgage
Purchase Details
Closed on
Nov 30, 2004
Sold by
Stevenson Charles P and Stevenson Kay
Bought by
Eliason Anita J and Shapiro Janina F
Create a Home Valuation Report for This Property
The Home Valuation Report is an in-depth analysis detailing your home's value as well as a comparison with similar homes in the area
Home Values in the Area
Average Home Value in this Area
Purchase History
| Date | Buyer | Sale Price | Title Company |
|---|---|---|---|
| Ray Evan L | $216,000 | -- | |
| Dorato Amanda N | $183,900 | -- | |
| Eliason Anita J | $134,000 | -- |
Source: Public Records
Mortgage History
| Date | Status | Borrower | Loan Amount |
|---|---|---|---|
| Open | Ray Evan L | $142,000 | |
| Previous Owner | Dorato Amanda N | $127,500 |
Source: Public Records
Tax History
| Year | Tax Paid | Tax Assessment Tax Assessment Total Assessment is a certain percentage of the fair market value that is determined by local assessors to be the total taxable value of land and additions on the property. | Land | Improvement |
|---|---|---|---|---|
| 2025 | $4,117 | $301,200 | $96,500 | $204,700 |
| 2024 | $3,976 | $293,200 | $93,700 | $199,500 |
| 2023 | $2,986 | $203,800 | $74,000 | $129,800 |
| 2022 | $3,369 | $203,800 | $74,000 | $129,800 |
| 2021 | $3,713 | $211,700 | $74,000 | $137,700 |
| 2020 | $3,619 | $203,800 | $74,000 | $129,800 |
| 2019 | $3,030 | $196,000 | $74,000 | $122,000 |
| 2018 | $2,922 | $182,600 | $69,800 | $112,800 |
| 2017 | $2,574 | $158,800 | $67,100 | $91,700 |
| 2016 | $2,496 | $160,100 | $67,100 | $93,000 |
| 2015 | $2,426 | $160,100 | $67,100 | $93,000 |
Source: Public Records
Map
Nearby Homes
- 4 Gaugh St
- 40 Clark St
- 2 Oak St
- 33 Knipfer Ave
- 19 Nicols Way Unit 19
- 7 Union Ct
- 12 Glen Cove Place Unit B
- 10 Glen Cove Place Unit A
- 18-20 Oakdale Place
- 29 Parsons St Unit 1
- 6 Wilton Rd
- 41 South St Unit 11
- 6 S St & Abutting Lots
- 11 Dragon Cir
- 336 Main St
- 2 W Park Dr
- 36 & 36R Holly Cir
- 385 Main St
- M143 &152 Glendale St
- 211 East St Unit 11
- 2 Cherry St
- 17 Holyoke St Unit 19
- 17-19 Holyoke St
- 18 Holyoke St
- Lot A2 Stonegate Dr
- 16 Holyoke St
- 23 Holyoke St
- 22 Holyoke St
- 22 Holyoke St
- 22 Holyoke St Unit 1
- 13 Holyoke St
- 24 Holyoke St
- 25 Holyoke St
- 25 Stone Path Ln
- 11 Holyoke St
- 1-3 Cherry St
- 1-3 Cherry St Unit 3B
- 1-3 Cherry St Unit 1B
- 3 Cherry St Unit A
- 27 Stone Path Ln
Your Personal Tour Guide
Ask me questions while you tour the home.