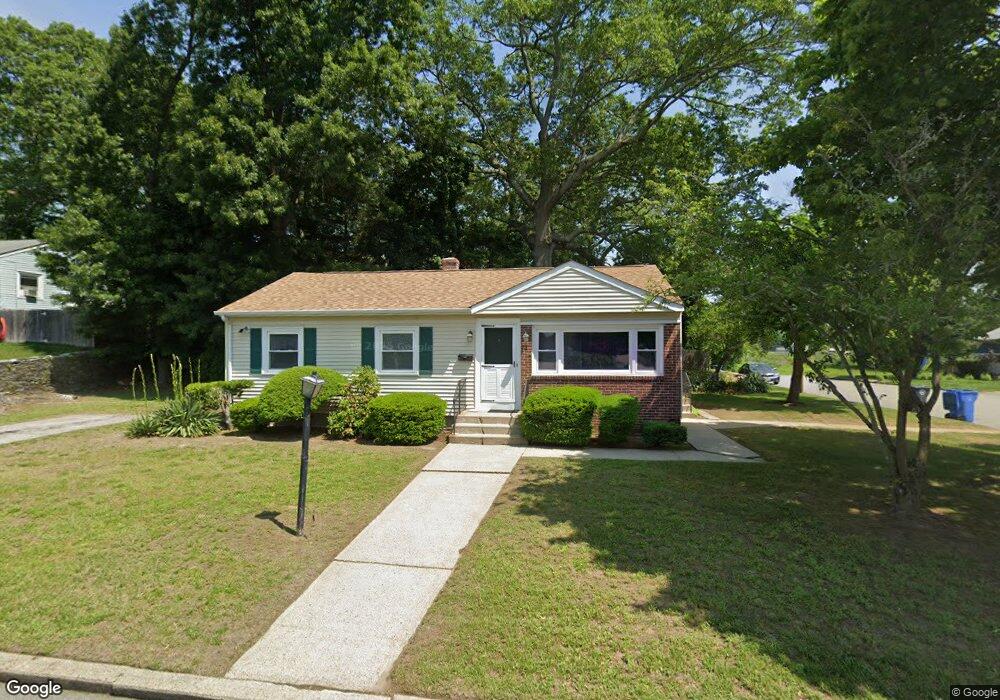
2 Davis Ct Cranston, RI 02910
Eden Park NeighborhoodEstimated Value: $358,175
3
Beds
1
Bath
960
Sq Ft
$373/Sq Ft
Est. Value
About This Home
This home is located at 2 Davis Ct, Cranston, RI 02910 and is currently estimated at $358,175, approximately $373 per square foot. 2 Davis Ct is a home with nearby schools including Park View Middle School, Cranston High School East, and Cadence Academy Preschool - Cranston.
Ownership History
Date
Name
Owned For
Owner Type
Purchase Details
Closed on
Jun 4, 1999
Sold by
Prata Antonio P and Prata Emma C
Bought by
Abilits Opportunities
Current Estimated Value
Home Financials for this Owner
Home Financials are based on the most recent Mortgage that was taken out on this home.
Original Mortgage
$68,200
Outstanding Balance
$16,997
Interest Rate
6.85%
Mortgage Type
Commercial
Estimated Equity
$341,178
Create a Home Valuation Report for This Property
The Home Valuation Report is an in-depth analysis detailing your home's value as well as a comparison with similar homes in the area
Home Values in the Area
Average Home Value in this Area
Purchase History
| Date | Buyer | Sale Price | Title Company |
|---|---|---|---|
| Abilits Opportunities | $89,000 | -- |
Source: Public Records
Mortgage History
| Date | Status | Borrower | Loan Amount |
|---|---|---|---|
| Open | Abilits Opportunities | $5,015 | |
| Open | Abilits Opportunities | $68,200 |
Source: Public Records
Tax History
| Year | Tax Paid | Tax Assessment Tax Assessment Total Assessment is a certain percentage of the fair market value that is determined by local assessors to be the total taxable value of land and additions on the property. | Land | Improvement |
|---|---|---|---|---|
| 2025 | -- | $296,700 | $110,600 | $186,100 |
| 2024 | -- | $296,700 | $110,600 | $186,100 |
| 2023 | $0 | $209,500 | $72,800 | $136,700 |
| 2022 | $0 | $209,500 | $72,800 | $136,700 |
| 2021 | $0 | $209,500 | $72,800 | $136,700 |
| 2020 | $0 | $179,100 | $69,400 | $109,700 |
| 2019 | $0 | $179,100 | $69,400 | $109,700 |
| 2018 | $0 | $179,100 | $69,400 | $109,700 |
| 2017 | $0 | $155,100 | $62,400 | $92,700 |
| 2016 | -- | $155,100 | $62,400 | $92,700 |
| 2015 | -- | $155,100 | $62,400 | $92,700 |
| 2014 | -- | $150,400 | $62,400 | $88,000 |
Source: Public Records
Map
Nearby Homes
Your Personal Tour Guide
Ask me questions while you tour the home.