Estimated Value: $751,000 - $1,018,000
2
Beds
3
Baths
2,145
Sq Ft
$394/Sq Ft
Est. Value
About This Home
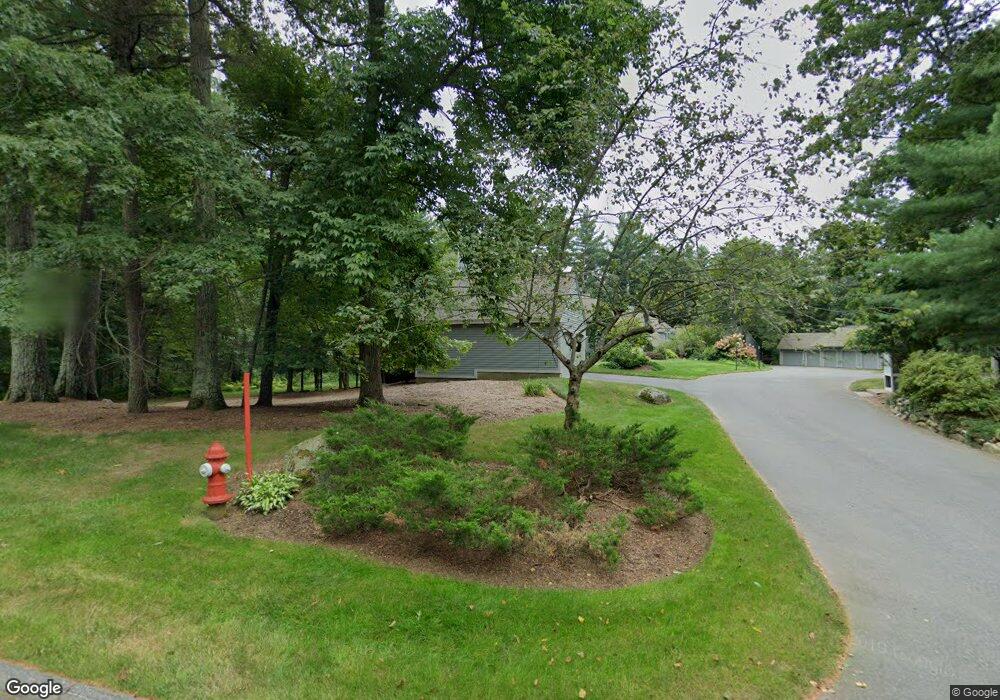
This home is located at 2 Deer Grass Ln Unit 2,2, Acton, MA 01720 and is currently estimated at $845,759, approximately $394 per square foot. 2 Deer Grass Ln Unit 2,2 is a home located in Middlesex County with nearby schools including Acton-Boxborough Regional High School and Oak Meadow Montessori School.
Ownership History
Date
Name
Owned For
Owner Type
Purchase Details
Closed on
Dec 30, 1998
Sold by
Naismith Robert J and Naismith Sharon L
Bought by
Frankel Lisa M
Current Estimated Value
Purchase Details
Closed on
Dec 13, 1996
Sold by
Herbener Donald H and Herbener Judith A
Bought by
Naismith Sharon L and Naismith Robert J
Home Financials for this Owner
Home Financials are based on the most recent Mortgage that was taken out on this home.
Original Mortgage
$150,000
Interest Rate
7.75%
Mortgage Type
Purchase Money Mortgage
Purchase Details
Closed on
Jan 31, 1994
Sold by
Anderson Robert J and Anderson Nancy B
Bought by
Herbener Donald H and Herbener Judith A
Home Financials for this Owner
Home Financials are based on the most recent Mortgage that was taken out on this home.
Original Mortgage
$175,000
Interest Rate
7.11%
Mortgage Type
Purchase Money Mortgage
Create a Home Valuation Report for This Property
The Home Valuation Report is an in-depth analysis detailing your home's value as well as a comparison with similar homes in the area
Home Values in the Area
Average Home Value in this Area
Purchase History
| Date | Buyer | Sale Price | Title Company |
|---|---|---|---|
| Frankel Lisa M | $319,000 | -- | |
| Naismith Sharon L | $299,000 | -- | |
| Herbener Donald H | $270,000 | -- |
Source: Public Records
Mortgage History
| Date | Status | Borrower | Loan Amount |
|---|---|---|---|
| Previous Owner | Herbener Donald H | $150,000 | |
| Previous Owner | Herbener Donald H | $30,000 | |
| Previous Owner | Herbener Donald H | $175,000 |
Source: Public Records
Tax History Compared to Growth
Tax History
| Year | Tax Paid | Tax Assessment Tax Assessment Total Assessment is a certain percentage of the fair market value that is determined by local assessors to be the total taxable value of land and additions on the property. | Land | Improvement |
|---|---|---|---|---|
| 2025 | $12,094 | $705,200 | $0 | $705,200 |
| 2024 | $10,789 | $647,200 | $0 | $647,200 |
| 2023 | $10,185 | $580,000 | $0 | $580,000 |
| 2022 | $11,357 | $583,900 | $0 | $583,900 |
| 2021 | $10,524 | $520,200 | $0 | $520,200 |
| 2020 | $9,712 | $504,800 | $0 | $504,800 |
| 2019 | $9,896 | $510,900 | $0 | $510,900 |
| 2018 | $10,157 | $524,100 | $0 | $524,100 |
| 2017 | $9,400 | $493,200 | $0 | $493,200 |
| 2016 | $8,890 | $462,300 | $0 | $462,300 |
| 2015 | $7,654 | $401,800 | $0 | $401,800 |
| 2014 | $8,078 | $415,300 | $0 | $415,300 |
Source: Public Records
Map
Nearby Homes
- 10 Blue Heron Way Unit 10
- 10 Blue Heron Way
- 7 Blue Heron Way
- 6 Bittersweet Ln
- 16 Wampus Ave Unit 32
- 386 Great Rd Unit A8
- 403 Great Rd Unit 5
- 407 Great Rd Unit 9
- 17 Northbriar Rd
- 1 Quarry Rd
- 420 Great Rd Unit B3
- 428 Great Rd Unit 10
- 209 Great Rd Unit C1
- 134 Pope Rd
- 159 Skyline Dr Unit 159
- 524 Main St
- 709 Main St
- 484 Great Rd
- 484 Great Rd
- 27 Hartland Way Unit 309
- 6 Deer Grass Ln
- 2 Deer Grass Ln
- 4 Deer Grass Ln
- 12 Deer Grass Ln
- 10 Deer Grass Ln
- 8 Deer Grass Ln
- 12 Deer Grass Ln Unit 12
- 6 Quail Run
- 4 Quail Run
- 2 Quail Run
- 6 Quail Run Unit 6
- 2 Blue Heron Way
- 12 Blue Heron Way
- 15 Blue Heron Way
- 11 Blue Heron Way
- 9 Blue Heron Way
- 9 Blue Heron Way Unit 9, Acton Ma 01720
- 3 Quail Run
- 1 Quail Run
- 5 Blue Heron Way