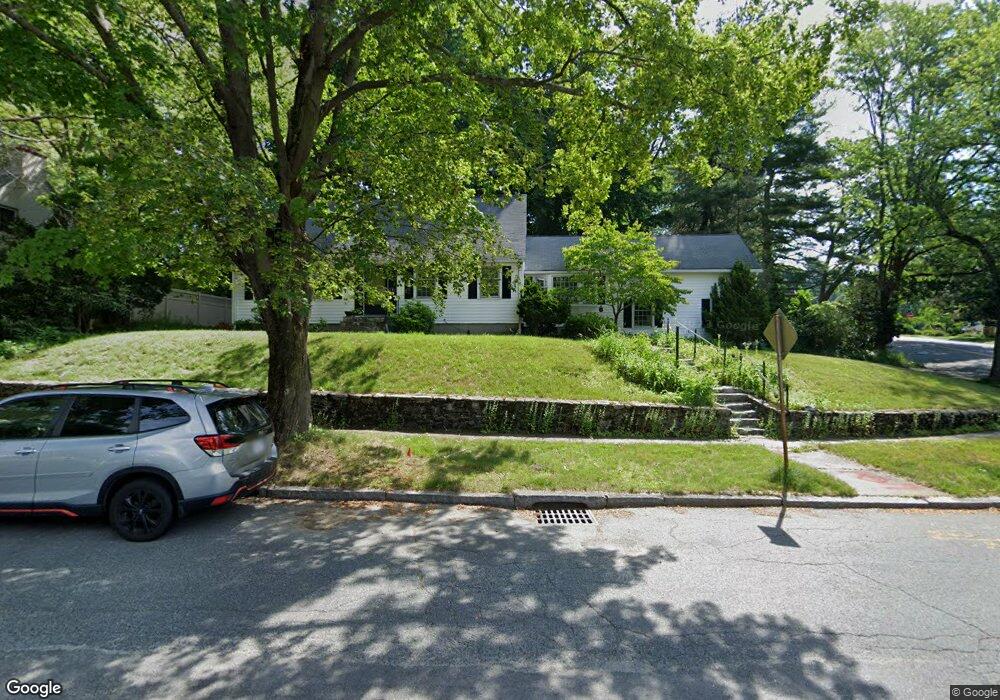
2 Dennison Rd Worcester, MA 01609
Salisbury Street NeighborhoodEstimated Value: $600,000 - $735,000
4
Beds
3
Baths
2,690
Sq Ft
$242/Sq Ft
Est. Value
About This Home
This home is located at 2 Dennison Rd, Worcester, MA 01609 and is currently estimated at $650,763, approximately $241 per square foot. 2 Dennison Rd is a home located in Worcester County with nearby schools including Chandler Magnet, Jacob Hiatt Magnet School, and Flagg Street School.
Ownership History
Date
Name
Owned For
Owner Type
Purchase Details
Closed on
Mar 26, 2019
Sold by
Newhouse Matthew A and Newhouse Jolene S
Bought by
Higley Hill Investments
Current Estimated Value
Purchase Details
Closed on
Sep 15, 2017
Sold by
Prashad Hardatt B and Prashad Drupatty
Bought by
Newhouse Matthew A and Newhouse Jolene S
Home Financials for this Owner
Home Financials are based on the most recent Mortgage that was taken out on this home.
Original Mortgage
$214,200
Interest Rate
3.93%
Mortgage Type
New Conventional
Purchase Details
Closed on
Mar 14, 2006
Sold by
Jones Frances H
Bought by
Prashad Hardatt B
Create a Home Valuation Report for This Property
The Home Valuation Report is an in-depth analysis detailing your home's value as well as a comparison with similar homes in the area
Home Values in the Area
Average Home Value in this Area
Purchase History
| Date | Buyer | Sale Price | Title Company |
|---|---|---|---|
| Higley Hill Investments | -- | -- | |
| Newhouse Matthew A | $252,500 | -- | |
| Prashad Hardatt B | $250,000 | -- |
Source: Public Records
Mortgage History
| Date | Status | Borrower | Loan Amount |
|---|---|---|---|
| Previous Owner | Newhouse Matthew A | $214,200 |
Source: Public Records
Tax History
| Year | Tax Paid | Tax Assessment Tax Assessment Total Assessment is a certain percentage of the fair market value that is determined by local assessors to be the total taxable value of land and additions on the property. | Land | Improvement |
|---|---|---|---|---|
| 2025 | $6,803 | $515,800 | $126,100 | $389,700 |
| 2024 | $6,628 | $482,000 | $126,100 | $355,900 |
| 2023 | $6,499 | $453,200 | $107,500 | $345,700 |
| 2022 | $6,008 | $395,000 | $86,000 | $309,000 |
| 2021 | $6,020 | $369,800 | $68,800 | $301,000 |
| 2020 | $5,821 | $342,400 | $68,600 | $273,800 |
| 2019 | $5,879 | $326,600 | $68,600 | $258,000 |
| 2018 | $5,858 | $309,800 | $68,600 | $241,200 |
| 2017 | $5,635 | $293,200 | $68,600 | $224,600 |
| 2016 | $5,826 | $282,700 | $58,000 | $224,700 |
| 2015 | $5,674 | $282,700 | $58,000 | $224,700 |
| 2014 | $5,524 | $282,700 | $58,000 | $224,700 |
Source: Public Records
Map
Nearby Homes
- 9 Dennison Rd
- 493 Salisbury St
- 6 Paul Revere Rd
- 8 Old Colony Rd
- 40 Westwood Dr
- 32 Aylesbury Rd
- 3 Old English Rd
- 22 Audubon Rd
- 14 Balder Rd
- 23 Orrison St
- 31 Lenox St
- 28 Lynnwood Ln
- 577 Grove St
- 163 Moreland St
- 85 Camelot Dr Unit 118
- 93 Newton Ave N
- 59 Beechmont St
- 49 Metcalf St
- 83 Newton Ave N
- 11 Holden St
Your Personal Tour Guide
Ask me questions while you tour the home.