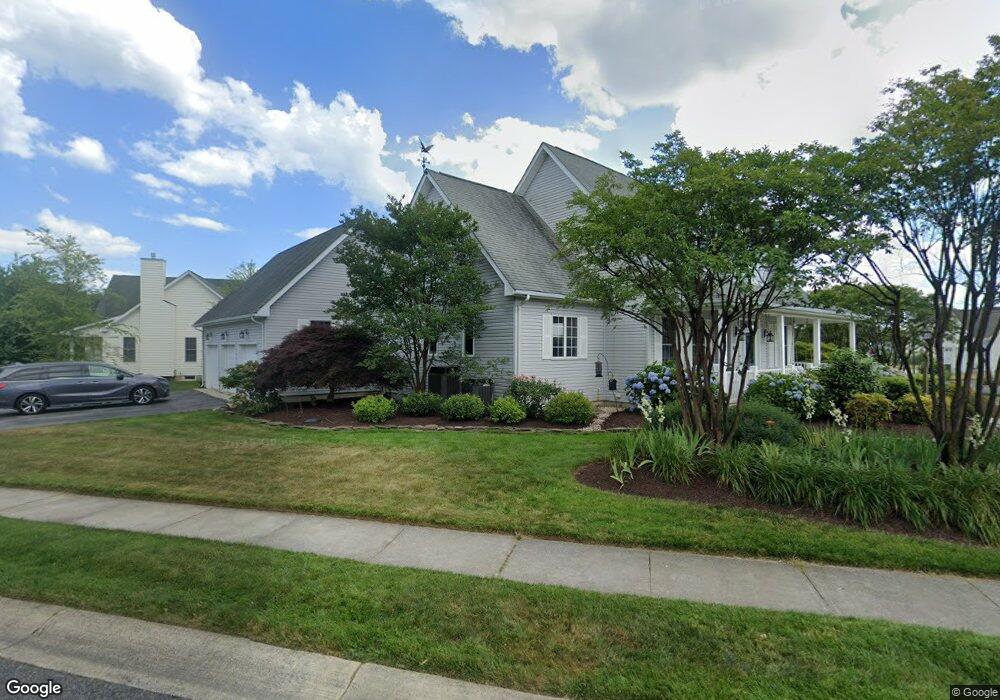
2 Doolin Ln Rehoboth Beach, DE 19971
Estimated Value: $913,000 - $1,053,000
4
Beds
4
Baths
2,513
Sq Ft
$392/Sq Ft
Est. Value
About This Home
This home is located at 2 Doolin Ln, Rehoboth Beach, DE 19971 and is currently estimated at $984,758, approximately $391 per square foot. 2 Doolin Ln is a home located in Sussex County with nearby schools including Rehoboth Elementary School, Mariner Middle School, and Cape Henlopen High School.
Ownership History
Date
Name
Owned For
Owner Type
Purchase Details
Closed on
Sep 26, 2016
Sold by
Marshall Marilyn E and Marshall Robert F
Bought by
Vavala Allison L and Vavala Joseph T
Current Estimated Value
Home Financials for this Owner
Home Financials are based on the most recent Mortgage that was taken out on this home.
Original Mortgage
$415,000
Outstanding Balance
$332,018
Interest Rate
3.48%
Estimated Equity
$652,740
Purchase Details
Closed on
Sep 23, 2016
Sold by
Marshall Marilyn E and Marshall Robert F
Bought by
Vavala Allison L and Vavala Joseph T
Home Financials for this Owner
Home Financials are based on the most recent Mortgage that was taken out on this home.
Original Mortgage
$415,000
Outstanding Balance
$332,018
Interest Rate
3.48%
Estimated Equity
$652,740
Purchase Details
Closed on
May 26, 2011
Bought by
Marshall Robert F and Marsh Marilyn E
Purchase Details
Closed on
May 16, 2011
Bought by
Marshall Robert F and Marsh Marilyn E
Create a Home Valuation Report for This Property
The Home Valuation Report is an in-depth analysis detailing your home's value as well as a comparison with similar homes in the area
Home Values in the Area
Average Home Value in this Area
Purchase History
| Date | Buyer | Sale Price | Title Company |
|---|---|---|---|
| Vavala Allison L | $525,000 | None Available | |
| Vavala Allison L | $525,000 | None Available | |
| Marshall Robert F | $505,000 | -- | |
| Marshall Robert F | $505,000 | -- |
Source: Public Records
Mortgage History
| Date | Status | Borrower | Loan Amount |
|---|---|---|---|
| Open | Vavala Allison L | $415,000 |
Source: Public Records
Tax History
| Year | Tax Paid | Tax Assessment Tax Assessment Total Assessment is a certain percentage of the fair market value that is determined by local assessors to be the total taxable value of land and additions on the property. | Land | Improvement |
|---|---|---|---|---|
| 2025 | $1,814 | $40,300 | $5,800 | $34,500 |
| 2024 | $1,986 | $40,300 | $5,800 | $34,500 |
| 2023 | $1,985 | $40,300 | $5,800 | $34,500 |
| 2022 | $1,915 | $40,300 | $5,800 | $34,500 |
| 2021 | $1,898 | $40,300 | $5,800 | $34,500 |
| 2020 | $1,892 | $40,300 | $5,800 | $34,500 |
| 2019 | $1,895 | $40,300 | $5,800 | $34,500 |
| 2018 | $1,770 | $40,300 | $0 | $0 |
| 2017 | $1,695 | $40,300 | $0 | $0 |
| 2016 | $1,508 | $37,750 | $0 | $0 |
| 2015 | $1,441 | $37,750 | $0 | $0 |
| 2014 | $1,430 | $37,750 | $0 | $0 |
Source: Public Records
Map
Nearby Homes
- 38 Kenmare Way
- 14 Doolin Ln
- 38025 Henry View Unit 40
- 36837 Winner Cir
- 7 Oranmore Ave
- 36836 Winner Cir
- 20299 Fleming Cir Unit 82
- 20234 Whitehead Cir Unit 100
- 26 Sunnyfield Rd Unit E-15
- 25 Baybreeze Rd Unit C-29
- 20291 Flagler Ct
- 5 Excalibur Ct
- 19879 Center Ave Unit 3135
- 19935 Sea Air Ave Unit 3263
- 13 Sheffield Rd
- 42 Branchwood Dr
- 11 Cornwall Rd
- 19952 1st Ave Unit 9
- 2 Branchwood Cir Unit A-14
- 20019 Golden Ave
Your Personal Tour Guide
Ask me questions while you tour the home.