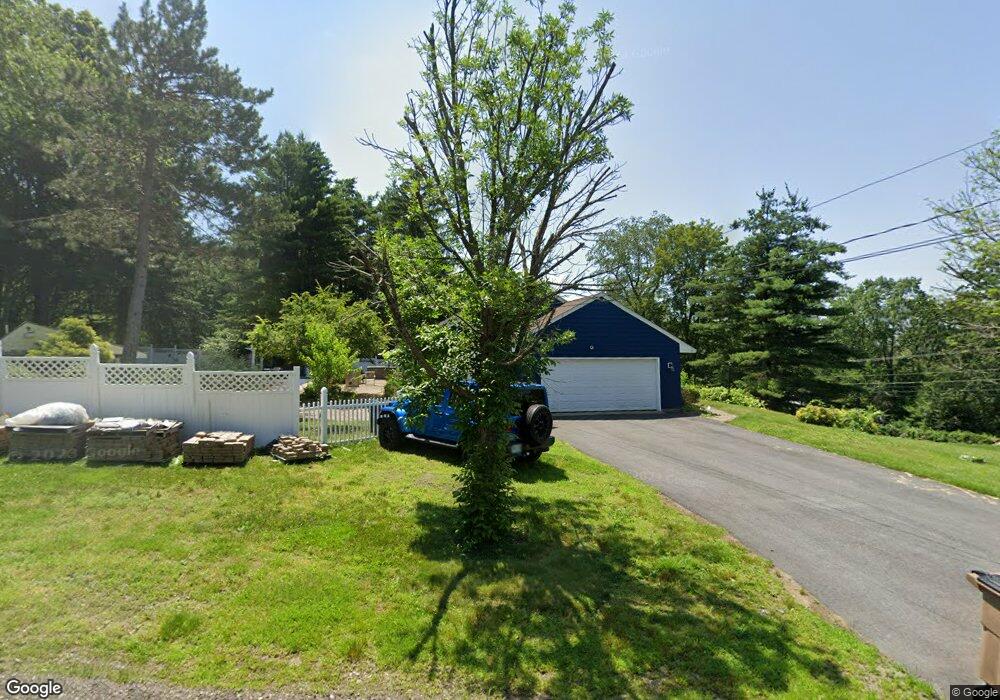
2 Farview Hill Rd Atkinson, NH 03811
Estimated Value: $675,000 - $743,000
3
Beds
4
Baths
2,990
Sq Ft
$237/Sq Ft
Est. Value
About This Home
This home is located at 2 Farview Hill Rd, Atkinson, NH 03811 and is currently estimated at $709,217, approximately $237 per square foot. 2 Farview Hill Rd is a home located in Rockingham County with nearby schools including Atkinson Academy, Timberlane Regional Middle School, and Timberlane Regional High School.
Ownership History
Date
Name
Owned For
Owner Type
Purchase Details
Closed on
Jul 20, 2018
Sold by
Dorine W Light Ft
Bought by
Davekos Randy
Current Estimated Value
Purchase Details
Closed on
May 2, 2002
Sold by
Lemay Charles and Lemay Jill
Bought by
Light Dorine
Home Financials for this Owner
Home Financials are based on the most recent Mortgage that was taken out on this home.
Original Mortgage
$170,000
Interest Rate
7.13%
Create a Home Valuation Report for This Property
The Home Valuation Report is an in-depth analysis detailing your home's value as well as a comparison with similar homes in the area
Home Values in the Area
Average Home Value in this Area
Purchase History
| Date | Buyer | Sale Price | Title Company |
|---|---|---|---|
| Davekos Randy | -- | -- | |
| Light Dorine | $285,000 | -- |
Source: Public Records
Mortgage History
| Date | Status | Borrower | Loan Amount |
|---|---|---|---|
| Previous Owner | Light Dorine | $240,000 | |
| Previous Owner | Light Dorine | $238,000 | |
| Previous Owner | Light Dorine | $170,000 |
Source: Public Records
Tax History
| Year | Tax Paid | Tax Assessment Tax Assessment Total Assessment is a certain percentage of the fair market value that is determined by local assessors to be the total taxable value of land and additions on the property. | Land | Improvement |
|---|---|---|---|---|
| 2024 | $7,341 | $568,200 | $244,000 | $324,200 |
| 2023 | $8,239 | $568,200 | $244,000 | $324,200 |
| 2022 | $6,972 | $568,200 | $244,000 | $324,200 |
| 2021 | $7,023 | $568,200 | $244,000 | $324,200 |
| 2020 | $6,579 | $358,700 | $162,800 | $195,900 |
| 2019 | $24,075 | $358,700 | $162,800 | $195,900 |
| 2018 | $6,431 | $358,700 | $162,800 | $195,900 |
| 2017 | $6,564 | $358,700 | $162,800 | $195,900 |
| 2016 | $8,107 | $358,700 | $162,800 | $195,900 |
| 2015 | $6,471 | $338,800 | $157,300 | $181,500 |
| 2014 | $6,355 | $332,700 | $157,300 | $175,400 |
| 2013 | $6,321 | $332,700 | $157,300 | $175,400 |
Source: Public Records
Map
Nearby Homes
- 11 Farview Hill Rd
- 169 Main St
- 6 Concord Dr Unit 4
- 29 Lexington Rd
- 17 Winslow Dr
- 3 Pages Ln
- 20 Chandler Dr
- 15 Marilyn Dr
- 92 Main St
- 30 Maple Ave
- 20 Larson Dr
- 37 Coles Way
- 7 Wason Ln
- 16 Fox Run Ln Unit 10382
- 16 Fox Run Ln
- 9 Valcat Ln
- 3 Longview Dr Unit 305
- 1 Longview Dr Unit 110
- 1 Longview Dr Unit 203
- 1 Longview Dr Unit 101
Your Personal Tour Guide
Ask me questions while you tour the home.