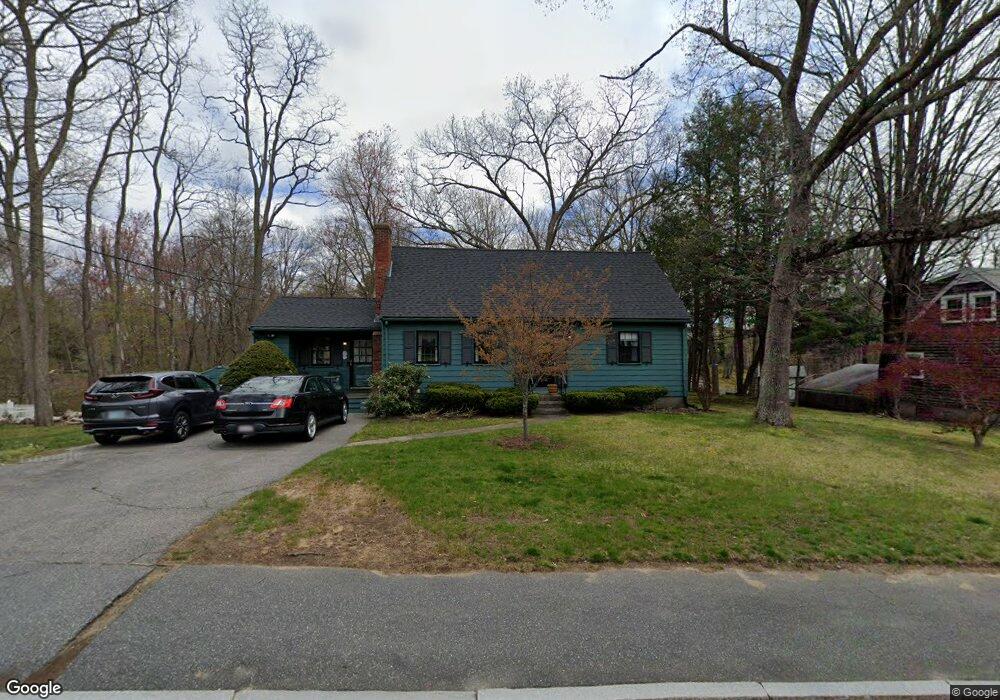
2 Frost St Framingham, MA 01701
Nobscot NeighborhoodEstimated Value: $584,666 - $656,000
5
Beds
1
Bath
1,656
Sq Ft
$367/Sq Ft
Est. Value
About This Home
This home is located at 2 Frost St, Framingham, MA 01701 and is currently estimated at $608,167, approximately $367 per square foot. 2 Frost St is a home located in Middlesex County with nearby schools including Framingham High School and Sudbury Valley School.
Ownership History
Date
Name
Owned For
Owner Type
Purchase Details
Closed on
May 13, 2014
Sold by
Manning William C and Manning Judith A
Bought by
William C C and William A J
Current Estimated Value
Purchase Details
Closed on
Dec 16, 1992
Sold by
Musico Dominic E
Bought by
Bowen Ronald D
Home Financials for this Owner
Home Financials are based on the most recent Mortgage that was taken out on this home.
Original Mortgage
$90,250
Interest Rate
8.3%
Mortgage Type
Purchase Money Mortgage
Purchase Details
Closed on
Jun 11, 1965
Bought by
Gately Marianne and Manning William C
Create a Home Valuation Report for This Property
The Home Valuation Report is an in-depth analysis detailing your home's value as well as a comparison with similar homes in the area
Home Values in the Area
Average Home Value in this Area
Purchase History
| Date | Buyer | Sale Price | Title Company |
|---|---|---|---|
| William C C | -- | -- | |
| Bowen Ronald D | $99,500 | -- | |
| Bowen Ronald D | $99,500 | -- | |
| Gately Marianne | -- | -- |
Source: Public Records
Mortgage History
| Date | Status | Borrower | Loan Amount |
|---|---|---|---|
| Previous Owner | Gately Marianne | $90,250 |
Source: Public Records
Tax History Compared to Growth
Tax History
| Year | Tax Paid | Tax Assessment Tax Assessment Total Assessment is a certain percentage of the fair market value that is determined by local assessors to be the total taxable value of land and additions on the property. | Land | Improvement |
|---|---|---|---|---|
| 2025 | $5,775 | $483,700 | $271,100 | $212,600 |
| 2024 | $5,606 | $449,900 | $242,200 | $207,700 |
| 2023 | $5,294 | $404,400 | $216,200 | $188,200 |
| 2022 | $5,418 | $394,300 | $196,100 | $198,200 |
| 2021 | $5,045 | $359,100 | $188,500 | $170,600 |
| 2020 | $5,062 | $337,900 | $171,300 | $166,600 |
| 2019 | $4,952 | $322,000 | $171,300 | $150,700 |
| 2018 | $4,888 | $299,500 | $164,900 | $134,600 |
| 2017 | $4,819 | $288,400 | $160,100 | $128,300 |
| 2016 | $4,746 | $273,100 | $160,100 | $113,000 |
| 2015 | $4,778 | $268,100 | $160,700 | $107,400 |
Source: Public Records
Map
Nearby Homes
- 769 Edgell Rd
- 36 Ruthellen Rd
- 32 Lyman Rd
- 484 Edgell Rd
- 30 Elda Rd
- 641 Grove St
- 78 Apple d or Rd
- 1 Brookvale Rd
- 40 Gregory Rd
- 53 Davidson Rd
- 15 Fairbrook Rd
- 41 James St
- 337 Edgell Rd
- 106 Baldwin Ave
- 4 Pioneer Rd Unit 4
- 7 Pioneer Rd Unit 7
- 5 Pioneer Rd Unit 5
- 50 Juniper Ln
- 21 Blackberry Ln
- 9 Hawk Ln Unit 28