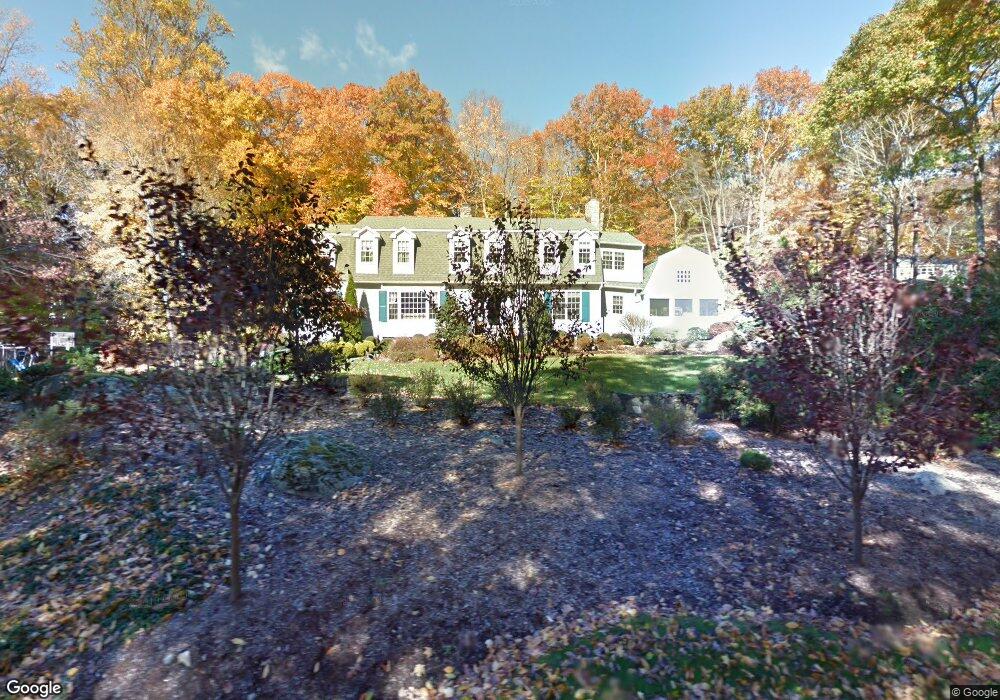
2 Greenlea Ct Weston, CT 06883
Coleytown NeighborhoodEstimated Value: $1,822,000 - $2,351,168
4
Beds
8
Baths
5,416
Sq Ft
$382/Sq Ft
Est. Value
About This Home
This home is located at 2 Greenlea Ct, Weston, CT 06883 and is currently estimated at $2,067,292, approximately $381 per square foot. 2 Greenlea Ct is a home located in Fairfield County with nearby schools including Coleytown Elementary School, Coleytown Middle School, and Staples High School.
Ownership History
Date
Name
Owned For
Owner Type
Purchase Details
Closed on
Dec 31, 2012
Sold by
Weissenberg Carol S
Bought by
Weissenberg Tr Carol S
Current Estimated Value
Purchase Details
Closed on
Jun 5, 2002
Sold by
Oost-Lievense Willem and Oost-Levense Marian
Bought by
Weissenberg Carol S
Purchase Details
Closed on
Mar 9, 1989
Sold by
Ellenbogen Jack
Bought by
Lievense William
Create a Home Valuation Report for This Property
The Home Valuation Report is an in-depth analysis detailing your home's value as well as a comparison with similar homes in the area
Home Values in the Area
Average Home Value in this Area
Purchase History
| Date | Buyer | Sale Price | Title Company |
|---|---|---|---|
| Weissenberg Tr Carol S | -- | -- | |
| Weissenberg Tr Carol S | -- | -- | |
| Weissenberg Carol S | $995,000 | -- | |
| Weissenberg Carol S | $995,000 | -- | |
| Lievense William | $545,000 | -- |
Source: Public Records
Mortgage History
| Date | Status | Borrower | Loan Amount |
|---|---|---|---|
| Previous Owner | Lievense William | $550,000 | |
| Previous Owner | Lievense William | $460,000 | |
| Previous Owner | Lievense William | $436,000 |
Source: Public Records
Tax History Compared to Growth
Tax History
| Year | Tax Paid | Tax Assessment Tax Assessment Total Assessment is a certain percentage of the fair market value that is determined by local assessors to be the total taxable value of land and additions on the property. | Land | Improvement |
|---|---|---|---|---|
| 2025 | $19,769 | $1,048,180 | $385,800 | $662,380 |
| 2024 | $19,517 | $1,048,200 | $385,800 | $662,400 |
| 2023 | $19,234 | $1,048,200 | $385,800 | $662,400 |
| 2022 | $18,941 | $1,048,200 | $385,800 | $662,400 |
| 2021 | $5,067 | $1,048,200 | $385,800 | $662,400 |
| 2020 | $19,995 | $1,196,600 | $391,900 | $804,700 |
| 2019 | $20,175 | $1,196,600 | $391,900 | $804,700 |
| 2018 | $20,175 | $1,196,600 | $391,900 | $804,700 |
| 2017 | $20,175 | $1,196,600 | $391,900 | $804,700 |
| 2016 | $20,175 | $1,196,600 | $391,900 | $804,700 |
| 2015 | $18,805 | $1,039,500 | $405,900 | $633,600 |
| 2014 | $18,649 | $1,039,500 | $405,900 | $633,600 |
Source: Public Records
Map
Nearby Homes
- 1 Greenlea Ln
- 17 Grays Farm Rd
- 130 Easton Rd
- 31 White Birch Rd
- 18 Hunt Ln
- 9 Greenbrier Rd
- 136 Lyons Plain Rd
- 18 Cardinal Rd
- 145 Lyons Plain Rd
- 4 Lyons Plain Rd
- 212 Fence Row Dr
- 24 Nordholm Dr
- 1375 Westport Turnpike
- 56 Charcoal Hill Rd
- 9 Berkeley Rd
- 101 Brambley Hedge Cir
- 2425 Merwins Ln
- 80 Gilbert Hwy
- 88 Merry Meet Center
- 6 Nutcracker Ln