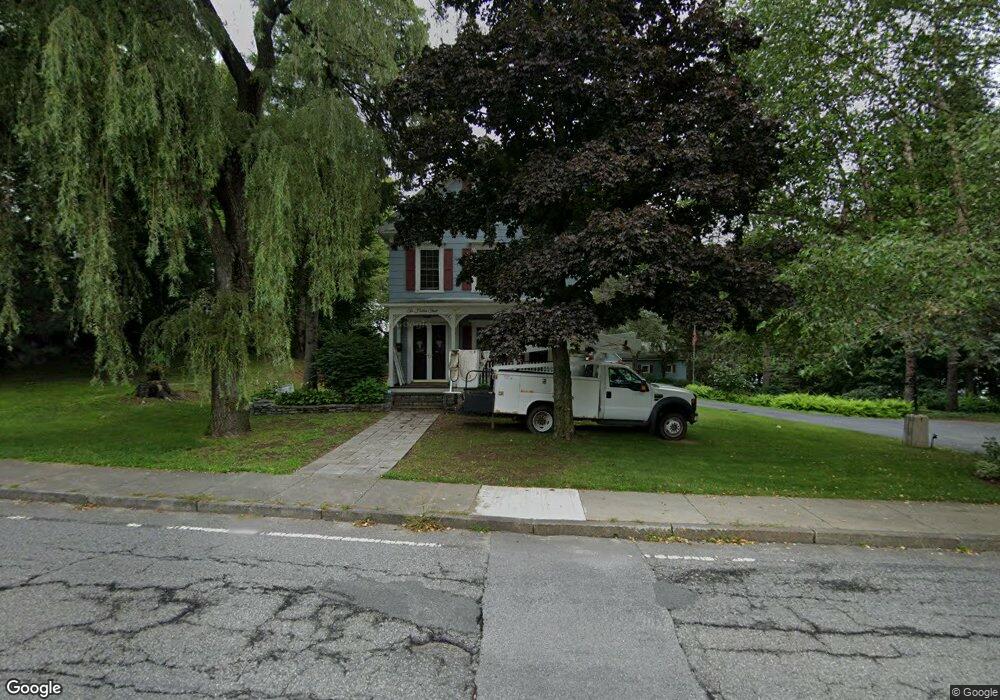
2 Holden St Worcester, MA 01605
Forest Grove NeighborhoodEstimated Value: $814,000 - $994,000
3
Beds
3
Baths
3,632
Sq Ft
$244/Sq Ft
Est. Value
About This Home
This home is located at 2 Holden St, Worcester, MA 01605 and is currently estimated at $885,230, approximately $243 per square foot. 2 Holden St is a home located in Worcester County with nearby schools including Nelson Place Elementary School, Jacob Hiatt Magnet School, and Chandler Magnet.
Ownership History
Date
Name
Owned For
Owner Type
Purchase Details
Closed on
Dec 11, 2025
Sold by
Proko S E S and Proko Samuel E
Bought by
Proko S E
Current Estimated Value
Home Financials for this Owner
Home Financials are based on the most recent Mortgage that was taken out on this home.
Original Mortgage
$210,000
Outstanding Balance
$209,798
Interest Rate
6.17%
Mortgage Type
New Conventional
Estimated Equity
$675,432
Purchase Details
Closed on
Apr 29, 1997
Sold by
Proko S Edward S and Proko Elizabeth
Bought by
Azizian Shavarsh and Azizian Lusia
Purchase Details
Closed on
Oct 29, 1993
Sold by
Senter Kenneth A and Senter Jean
Bought by
Proko S Edward S and Proko Elizabeth
Create a Home Valuation Report for This Property
The Home Valuation Report is an in-depth analysis detailing your home's value as well as a comparison with similar homes in the area
Home Values in the Area
Average Home Value in this Area
Purchase History
| Date | Buyer | Sale Price | Title Company |
|---|---|---|---|
| Proko S E | $143,285 | -- | |
| Azizian Shavarsh | $10,000 | -- | |
| Proko S Edward S | $182,500 | -- |
Source: Public Records
Mortgage History
| Date | Status | Borrower | Loan Amount |
|---|---|---|---|
| Open | Proko S E | $210,000 | |
| Previous Owner | Proko S Edward S | $110,500 | |
| Previous Owner | Proko S Edward S | $117,500 |
Source: Public Records
Tax History
| Year | Tax Paid | Tax Assessment Tax Assessment Total Assessment is a certain percentage of the fair market value that is determined by local assessors to be the total taxable value of land and additions on the property. | Land | Improvement |
|---|---|---|---|---|
| 2025 | $9,525 | $722,104 | $280,804 | $441,300 |
| 2024 | $9,247 | $672,504 | $280,804 | $391,700 |
| 2023 | $8,810 | $614,352 | $242,952 | $371,400 |
| 2022 | $8,989 | $591,024 | $255,724 | $335,300 |
| 2021 | $8,815 | $541,478 | $206,078 | $335,400 |
| 2020 | $8,548 | $502,800 | $205,300 | $297,500 |
| 2019 | $7,411 | $411,700 | $139,700 | $272,000 |
| 2018 | $7,451 | $394,000 | $139,700 | $254,300 |
| 2017 | $7,413 | $385,700 | $139,700 | $246,000 |
| 2016 | $7,681 | $372,700 | $124,500 | $248,200 |
| 2015 | $7,480 | $372,700 | $124,500 | $248,200 |
| 2014 | $7,283 | $372,700 | $124,500 | $248,200 |
Source: Public Records
Map
Nearby Homes