Estimated Value: $1,236,000 - $1,966,923
4
Beds
3
Baths
2,361
Sq Ft
$674/Sq Ft
Est. Value
About This Home
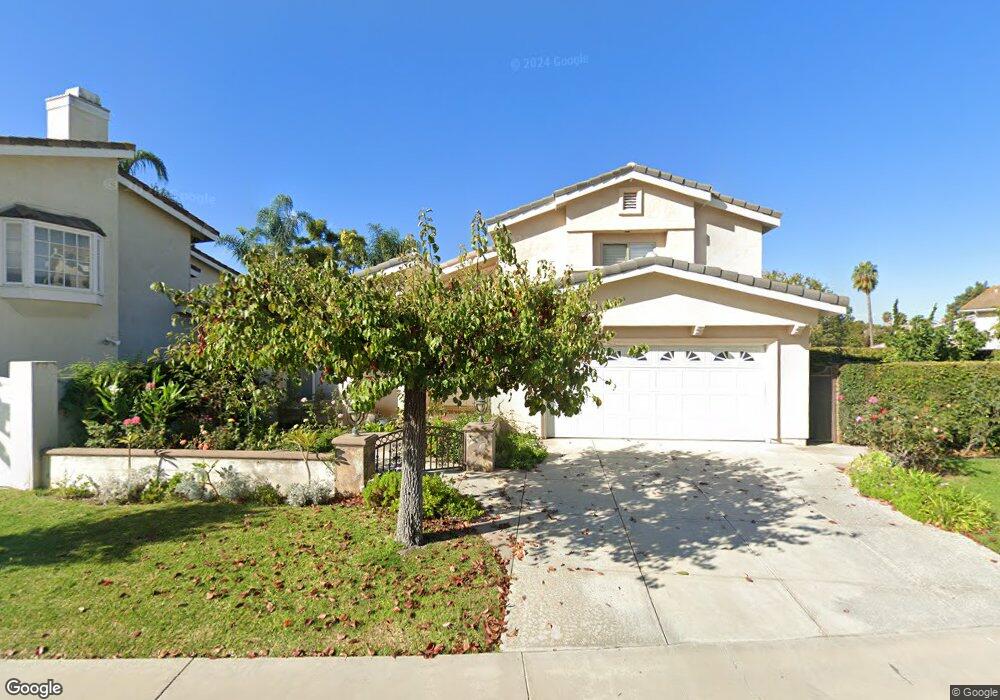
This home is located at 2 Holly St, Irvine, CA 92612 and is currently estimated at $1,592,481, approximately $674 per square foot. 2 Holly St is a home located in Orange County with nearby schools including University Park Elementary, Rancho San Joaquin Middle School, and University High School.
Ownership History
Date
Name
Owned For
Owner Type
Purchase Details
Closed on
Jan 28, 2021
Sold by
Yim Seong Sun and Yim Young Sook
Bought by
Yim Isaac Young and The Yim Family Irrevocable Tru
Current Estimated Value
Purchase Details
Closed on
Aug 17, 2012
Sold by
Yim Seong Sun
Bought by
Yim Seong Sum and Yim Young
Home Financials for this Owner
Home Financials are based on the most recent Mortgage that was taken out on this home.
Original Mortgage
$397,000
Interest Rate
3.53%
Mortgage Type
New Conventional
Purchase Details
Closed on
Jun 30, 2003
Sold by
Bond James D and Bond Kathleen M
Bought by
Yim Seong Sun and Yim Young
Home Financials for this Owner
Home Financials are based on the most recent Mortgage that was taken out on this home.
Original Mortgage
$320,000
Interest Rate
5.13%
Mortgage Type
Purchase Money Mortgage
Create a Home Valuation Report for This Property
The Home Valuation Report is an in-depth analysis detailing your home's value as well as a comparison with similar homes in the area
Home Values in the Area
Average Home Value in this Area
Purchase History
| Date | Buyer | Sale Price | Title Company |
|---|---|---|---|
| Yim Isaac Young | -- | None Available | |
| Yim Seong Sum | -- | Lsi Title Company | |
| Yim Seong Sun | -- | Lsi Title Company | |
| Yim Seong Sun | $451,500 | First American Title Co |
Source: Public Records
Mortgage History
| Date | Status | Borrower | Loan Amount |
|---|---|---|---|
| Previous Owner | Yim Seong Sun | $397,000 | |
| Previous Owner | Yim Seong Sun | $320,000 |
Source: Public Records
Tax History
| Year | Tax Paid | Tax Assessment Tax Assessment Total Assessment is a certain percentage of the fair market value that is determined by local assessors to be the total taxable value of land and additions on the property. | Land | Improvement |
|---|---|---|---|---|
| 2025 | $5,674 | $552,367 | $265,313 | $287,054 |
| 2024 | $5,674 | $541,537 | $260,111 | $281,426 |
| 2023 | $5,527 | $530,919 | $255,011 | $275,908 |
| 2022 | $5,426 | $520,509 | $250,010 | $270,499 |
| 2021 | $5,304 | $510,303 | $245,107 | $265,196 |
| 2020 | $5,273 | $505,071 | $242,594 | $262,477 |
| 2019 | $5,155 | $495,168 | $237,837 | $257,331 |
| 2018 | $5,062 | $485,459 | $233,173 | $252,286 |
| 2017 | $4,956 | $475,941 | $228,601 | $247,340 |
| 2016 | $4,734 | $466,609 | $224,118 | $242,491 |
| 2015 | $4,662 | $459,601 | $220,752 | $238,849 |
| 2014 | $4,570 | $450,599 | $216,428 | $234,171 |
Source: Public Records
Map
Nearby Homes
- 1 Holly St
- 18 Broadleaf
- 17682 Cassia Tree Ln
- 9 Teakwood
- 123 Willowbend
- 48 Willow Tree Ln
- 16 Rustling Wind
- 16 Charity
- 94 Sequoia Tree Ln
- 2 Shasta
- 45 Wintermist Unit 36
- 26 Seton Rd
- 52 Weepingwood
- 24 Spicewood Way
- 20 Wintermist
- 154 Echo Run Unit 66
- 92 Echo Run Unit 34
- 33 Mann St
- 41 Seton Rd
- 11 Rockrose Way
Your Personal Tour Guide
Ask me questions while you tour the home.