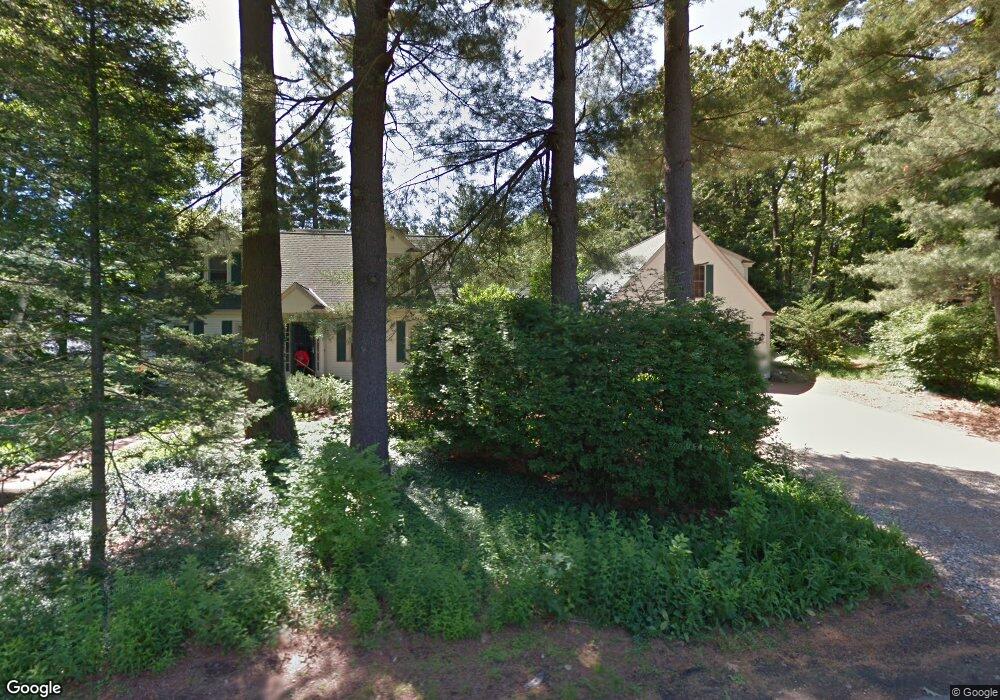
2 Indian Summer Ln Methuen, MA 01844
Downtown Methuen NeighborhoodEstimated Value: $681,000 - $810,000
4
Beds
2
Baths
2,866
Sq Ft
$258/Sq Ft
Est. Value
About This Home
This home is located at 2 Indian Summer Ln, Methuen, MA 01844 and is currently estimated at $738,618, approximately $257 per square foot. 2 Indian Summer Ln is a home located in Essex County with nearby schools including Tenney Grammar School, Methuen High School, and Saint Monica School.
Ownership History
Date
Name
Owned For
Owner Type
Purchase Details
Closed on
Sep 9, 2019
Sold by
Galloway Timothy E and Galloway Eleanor
Bought by
Galloway Timothy E and Galloway Eleanor
Current Estimated Value
Purchase Details
Closed on
Oct 1, 1986
Bought by
Galloway Timothy
Create a Home Valuation Report for This Property
The Home Valuation Report is an in-depth analysis detailing your home's value as well as a comparison with similar homes in the area
Home Values in the Area
Average Home Value in this Area
Purchase History
| Date | Buyer | Sale Price | Title Company |
|---|---|---|---|
| Galloway Timothy E | -- | -- | |
| Galloway Timothy E | -- | -- | |
| Galloway Timothy E | -- | -- | |
| Galloway Timothy | $125,000 | -- |
Source: Public Records
Mortgage History
| Date | Status | Borrower | Loan Amount |
|---|---|---|---|
| Previous Owner | Galloway Timothy | $235,000 | |
| Previous Owner | Galloway Timothy | $159,000 | |
| Previous Owner | Galloway Timothy | $50,000 |
Source: Public Records
Tax History
| Year | Tax Paid | Tax Assessment Tax Assessment Total Assessment is a certain percentage of the fair market value that is determined by local assessors to be the total taxable value of land and additions on the property. | Land | Improvement |
|---|---|---|---|---|
| 2025 | $7,586 | $717,000 | $305,500 | $411,500 |
| 2024 | $7,496 | $690,200 | $278,700 | $411,500 |
| 2023 | $7,016 | $599,700 | $247,700 | $352,000 |
| 2022 | $6,616 | $507,000 | $206,400 | $300,600 |
| 2021 | $6,286 | $476,600 | $196,100 | $280,500 |
| 2020 | $6,298 | $468,600 | $196,100 | $272,500 |
| 2019 | $6,004 | $423,100 | $175,500 | $247,600 |
| 2018 | $5,872 | $411,500 | $175,500 | $236,000 |
| 2017 | $5,674 | $387,300 | $175,500 | $211,800 |
| 2016 | $5,286 | $356,900 | $165,200 | $191,700 |
| 2015 | $4,968 | $340,300 | $165,200 | $175,100 |
Source: Public Records
Map
Nearby Homes
- 97 Kenwood Rd
- 687 Jackson St
- 25 Carol Ave
- 2 Grove St
- 9-11 Horne St
- 82 Oakside Ave
- Lot 108 Garden City Rd
- 7-9 Carleton Ct
- 611 Prospect St
- 23 Bentley Cir
- 7 Brentwood Ave
- 14 Buttonwood Dr
- 24 Railroad St
- 593 Prospect St
- 29 Center St
- 64-66 Howe St
- 20-22 Ashland Ave
- 23 Chase St
- 7 Field Ave
- 19 Hampshire Rd Unit 304
Your Personal Tour Guide
Ask me questions while you tour the home.