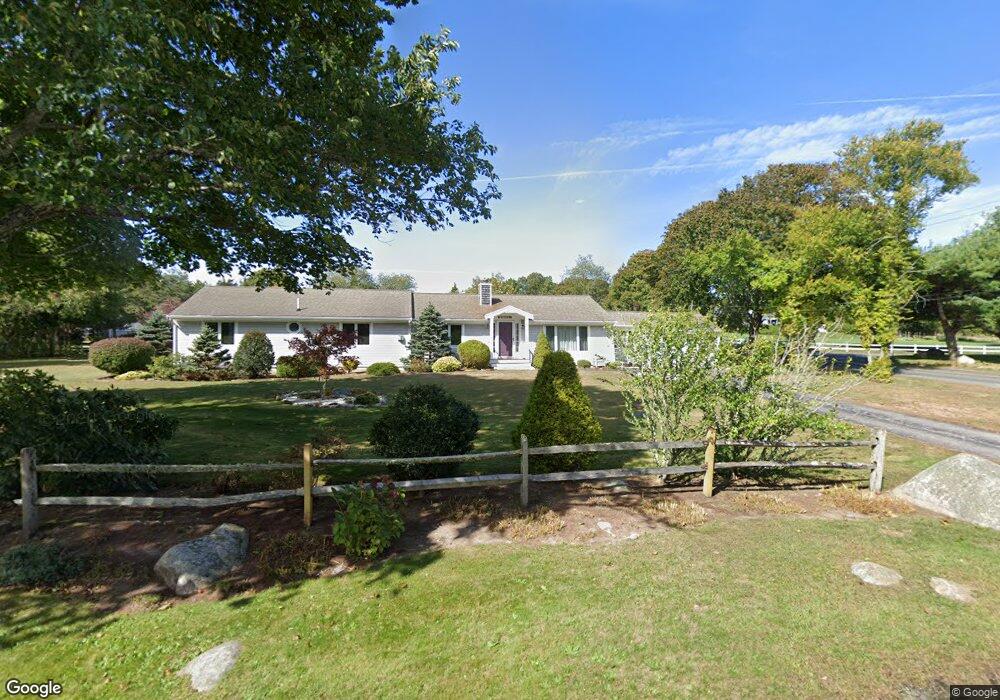
2 Island Dr Pocasset, MA 02559
Pocasset NeighborhoodEstimated Value: $753,000 - $996,000
3
Beds
2
Baths
1,950
Sq Ft
$437/Sq Ft
Est. Value
About This Home
This home is located at 2 Island Dr, Pocasset, MA 02559 and is currently estimated at $852,449, approximately $437 per square foot. 2 Island Dr is a home located in Barnstable County with nearby schools including Bourne High School and Cadence Academy Preschool - Bourne.
Ownership History
Date
Name
Owned For
Owner Type
Purchase Details
Closed on
Sep 18, 1998
Sold by
Randolph Janice Hutt and Minihan Joh C
Bought by
Viehl Kenneth F and Viehl Erin B
Current Estimated Value
Home Financials for this Owner
Home Financials are based on the most recent Mortgage that was taken out on this home.
Original Mortgage
$100,000
Outstanding Balance
$20,287
Interest Rate
6.9%
Mortgage Type
Purchase Money Mortgage
Estimated Equity
$832,162
Create a Home Valuation Report for This Property
The Home Valuation Report is an in-depth analysis detailing your home's value as well as a comparison with similar homes in the area
Home Values in the Area
Average Home Value in this Area
Purchase History
| Date | Buyer | Sale Price | Title Company |
|---|---|---|---|
| Viehl Kenneth F | $125,000 | -- | |
| Viehl Kenneth F | $125,000 | -- |
Source: Public Records
Mortgage History
| Date | Status | Borrower | Loan Amount |
|---|---|---|---|
| Open | Viehl Kenneth F | $100,000 | |
| Closed | Viehl Kenneth F | $100,000 |
Source: Public Records
Tax History
| Year | Tax Paid | Tax Assessment Tax Assessment Total Assessment is a certain percentage of the fair market value that is determined by local assessors to be the total taxable value of land and additions on the property. | Land | Improvement |
|---|---|---|---|---|
| 2025 | $6,543 | $837,800 | $388,200 | $449,600 |
| 2024 | $6,114 | $762,300 | $369,700 | $392,600 |
| 2023 | $5,704 | $647,500 | $299,900 | $347,600 |
| 2022 | $5,464 | $541,500 | $265,400 | $276,100 |
| 2021 | $5,292 | $491,400 | $241,600 | $249,800 |
| 2020 | $5,136 | $478,200 | $239,300 | $238,900 |
| 2019 | $4,885 | $464,800 | $239,300 | $225,500 |
| 2018 | $4,554 | $432,100 | $227,900 | $204,200 |
| 2017 | $4,204 | $408,200 | $225,800 | $182,400 |
| 2016 | $3,823 | $376,300 | $198,400 | $177,900 |
| 2015 | $3,789 | $376,300 | $198,400 | $177,900 |
Source: Public Records
Map
Nearby Homes
Your Personal Tour Guide
Ask me questions while you tour the home.