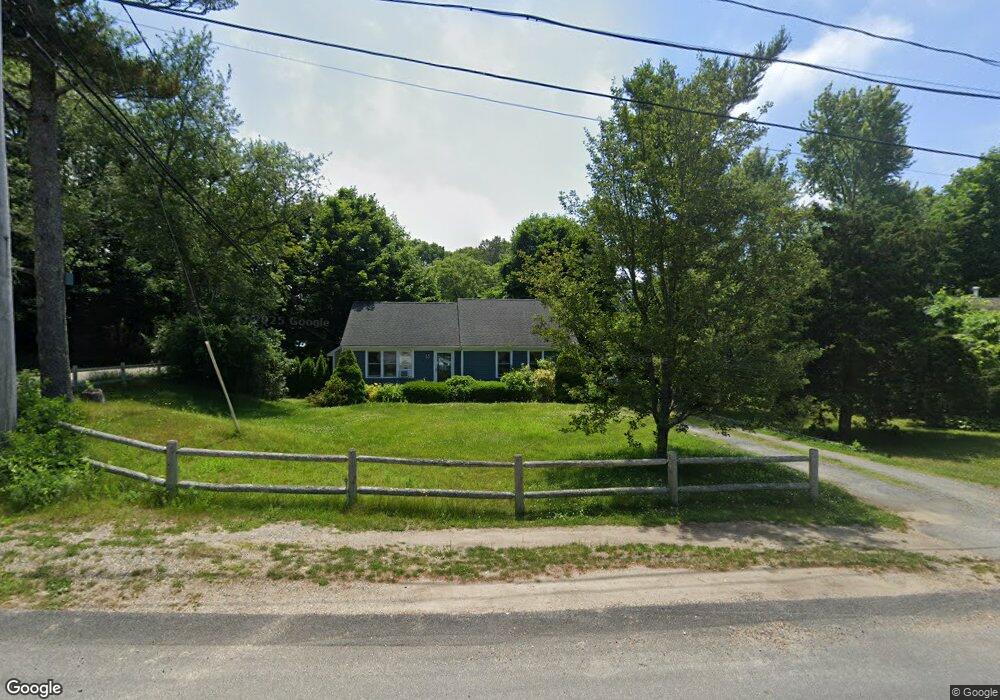
2 Juniper St Plymouth, MA 02360
Estimated Value: $450,000 - $544,000
2
Beds
2
Baths
1,480
Sq Ft
$333/Sq Ft
Est. Value
About This Home
This home is located at 2 Juniper St, Plymouth, MA 02360 and is currently estimated at $492,259, approximately $332 per square foot. 2 Juniper St is a home located in Plymouth County with nearby schools including South Elementary School, Plymouth South Middle School, and Plymouth South High School.
Ownership History
Date
Name
Owned For
Owner Type
Purchase Details
Closed on
Aug 31, 2011
Sold by
Realini Debra A
Bought by
Carey Mark
Current Estimated Value
Home Financials for this Owner
Home Financials are based on the most recent Mortgage that was taken out on this home.
Original Mortgage
$207,252
Outstanding Balance
$141,857
Interest Rate
4.25%
Mortgage Type
FHA
Estimated Equity
$350,402
Purchase Details
Closed on
Jul 24, 1998
Sold by
Check Constance J and Check Doris A
Bought by
Parrish Stewart S and Parrish Helen M
Create a Home Valuation Report for This Property
The Home Valuation Report is an in-depth analysis detailing your home's value as well as a comparison with similar homes in the area
Home Values in the Area
Average Home Value in this Area
Purchase History
| Date | Buyer | Sale Price | Title Company |
|---|---|---|---|
| Carey Mark | $216,000 | -- | |
| Parrish Stewart S | $23,000 | -- |
Source: Public Records
Mortgage History
| Date | Status | Borrower | Loan Amount |
|---|---|---|---|
| Open | Carey Mark | $207,252 | |
| Previous Owner | Parrish Stewart S | $215,000 |
Source: Public Records
Tax History Compared to Growth
Tax History
| Year | Tax Paid | Tax Assessment Tax Assessment Total Assessment is a certain percentage of the fair market value that is determined by local assessors to be the total taxable value of land and additions on the property. | Land | Improvement |
|---|---|---|---|---|
| 2025 | $5,341 | $420,900 | $167,000 | $253,900 |
| 2024 | $5,126 | $398,300 | $163,500 | $234,800 |
| 2023 | $4,937 | $360,100 | $142,800 | $217,300 |
| 2022 | $4,486 | $290,700 | $129,800 | $160,900 |
| 2021 | $4,308 | $266,600 | $129,800 | $136,800 |
| 2020 | $4,068 | $248,800 | $113,700 | $135,100 |
| 2019 | $3,834 | $231,800 | $101,200 | $130,600 |
| 2018 | $3,659 | $222,300 | $93,500 | $128,800 |
| 2017 | $3,493 | $210,700 | $93,500 | $117,200 |
| 2016 | $3,241 | $199,200 | $80,900 | $118,300 |
| 2015 | $3,184 | $204,900 | $85,700 | $119,200 |
| 2014 | $3,117 | $206,000 | $90,400 | $115,600 |
Source: Public Records
Map
Nearby Homes
- 14 Buttonwood Ln
- 23 Pine Ridge Rd
- 110 Packard St
- 11 Thompson Rd Unit 11A
- 11 Thompson Rd Unit A
- 27 Baker Ln Unit 27H
- 13 Hideaway Village Unit G
- 18 Martin St
- 9 Hideaway Rd Unit F
- 810 Head of The Bay Rd
- 3132 Cranberry Hwy Unit 59
- 73 Lewis Point Rd
- 69 Bay Pointe Drive Extension Unit 69
- 65 Lewis Point Rd
- 3 Wolf Rd
- 45 Bay Pointe Drive Extension Unit 45
- 56 Rip Van Winkle Way
- 0 Lewis Point Rd
- 13 Bay Pointe Drive Extension Unit 13
- 37 Bay Pointe Drive Extension Unit 37