
Seller's Agent in 2023
Audrey Brodie
First Class Properties
(302) 331-1043
148 Total Sales
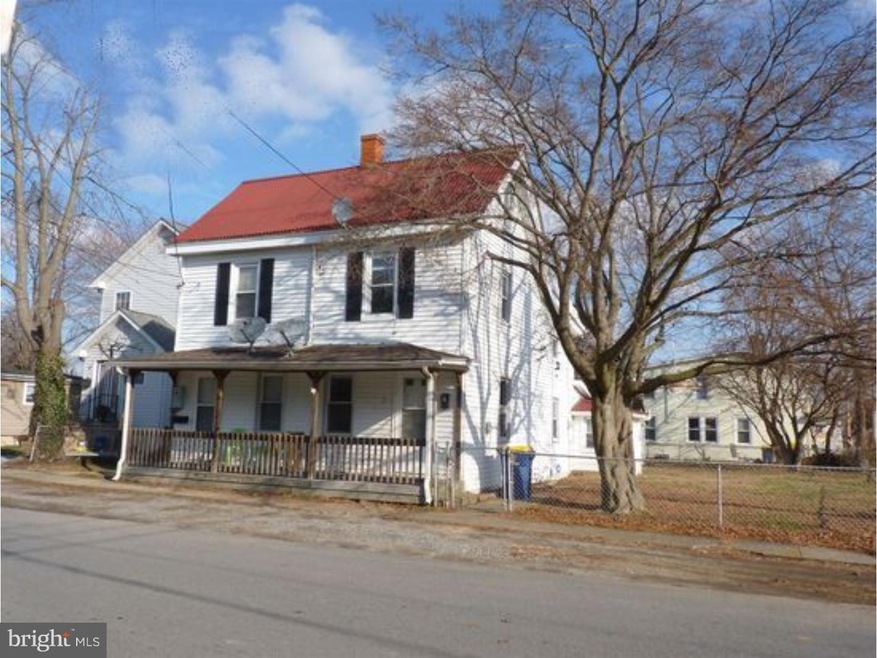
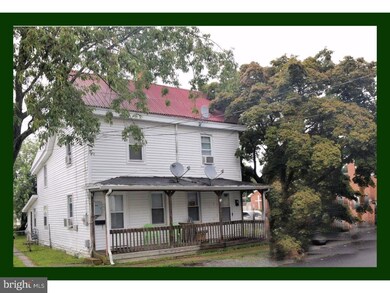
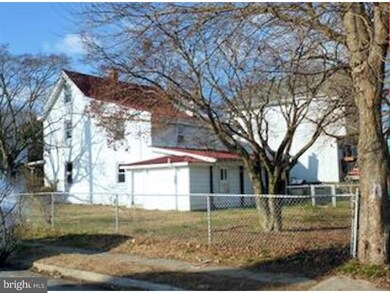
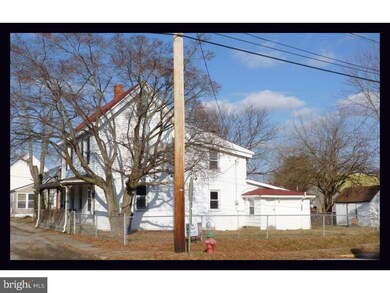
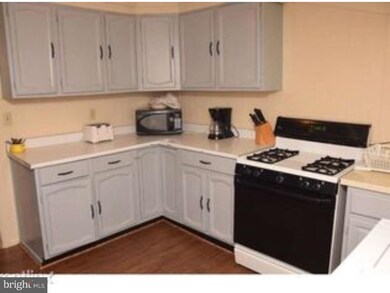
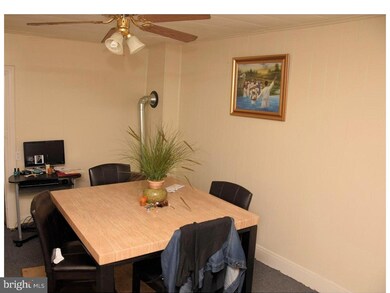
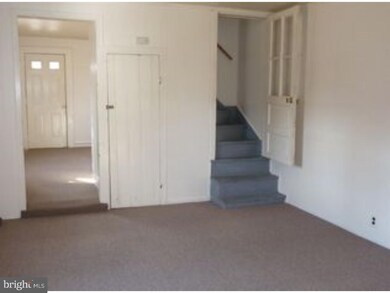
R-10677. INVESTOR ALERT! Drastically reduced by 40k and back to active due to buyers financing. Incredible opportunity for great residual income. GREAT INVEST Not another investment property like this on the market today. Duplex with 2 income producing units now available in the town of Smyrna. Both units are leased. Unit 1 rents for 650 and unit 2 rents for 850. Unit 1 is renting for approximately 200 under market value. Tenants are responsible for their own utilities. Both units are mirrors of one another. The yard is completely fenced in and there is a storage shed. Very close to schools and shopping and easy access to Route 1. Call with any questions. Will be gone very fast at this price!All inspections are complete and available to serious buyer.
Last Agent to Sell the Property
Iron Valley Real Estate at The Beach Listed on: 10/02/2018
Last Buyer's Agent
Ken Brodie
First Class Properties
| Date | Type | Sale Price | Title Company |
|---|---|---|---|
| Deed | $92,000 | None Available | |
| Deed | $28,000 | None Available |
| Date | Status | Loan Amount | Loan Type |
|---|---|---|---|
| Open | $69,000 | Future Advance Clause Open End Mortgage |
| Date | Event | Price | Change | Sq Ft Price |
|---|---|---|---|---|
| 10/25/2023 10/25/23 | Sold | $200,000 | -11.1% | $117 / Sq Ft |
| 09/28/2023 09/28/23 | Pending | -- | -- | -- |
| 09/18/2023 09/18/23 | For Sale | $225,000 | 0.0% | $131 / Sq Ft |
| 07/01/2023 07/01/23 | Rented | $1,100 | 0.0% | -- |
| 06/22/2023 06/22/23 | Under Contract | -- | -- | -- |
| 05/16/2023 05/16/23 | For Rent | $1,100 | +29.4% | -- |
| 01/15/2020 01/15/20 | Rented | $850 | 0.0% | -- |
| 01/02/2020 01/02/20 | Off Market | $850 | -- | -- |
| 12/23/2019 12/23/19 | For Rent | $850 | 0.0% | -- |
| 07/05/2019 07/05/19 | Rented | $850 | 0.0% | -- |
| 06/11/2019 06/11/19 | Off Market | $850 | -- | -- |
| 05/29/2019 05/29/19 | For Rent | $850 | 0.0% | -- |
| 05/23/2019 05/23/19 | Sold | $85,000 | -14.9% | $50 / Sq Ft |
| 04/18/2019 04/18/19 | Pending | -- | -- | -- |
| 04/10/2019 04/10/19 | Price Changed | $99,900 | 0.0% | $58 / Sq Ft |
| 04/10/2019 04/10/19 | For Sale | $99,900 | -13.1% | $58 / Sq Ft |
| 03/25/2019 03/25/19 | Pending | -- | -- | -- |
| 03/15/2019 03/15/19 | Price Changed | $114,900 | -10.9% | $67 / Sq Ft |
| 02/16/2019 02/16/19 | Price Changed | $129,000 | -7.8% | $75 / Sq Ft |
| 12/10/2018 12/10/18 | Price Changed | $139,900 | -5.4% | $82 / Sq Ft |
| 11/01/2018 11/01/18 | Price Changed | $147,900 | -1.3% | $86 / Sq Ft |
| 10/02/2018 10/02/18 | For Sale | $149,900 | +62.9% | $87 / Sq Ft |
| 10/30/2015 10/30/15 | Sold | $92,000 | -7.0% | $54 / Sq Ft |
| 08/31/2015 08/31/15 | Pending | -- | -- | -- |
| 07/31/2015 07/31/15 | For Sale | $98,900 | -- | $58 / Sq Ft |
| Year | Tax Paid | Tax Assessment Tax Assessment Total Assessment is a certain percentage of the fair market value that is determined by local assessors to be the total taxable value of land and additions on the property. | Land | Improvement |
|---|---|---|---|---|
| 2024 | $876 | $207,700 | $42,200 | $165,500 |
| 2023 | $547 | $20,600 | $3,700 | $16,900 |
| 2022 | $522 | $20,600 | $3,700 | $16,900 |
| 2021 | $511 | $20,600 | $3,700 | $16,900 |
| 2020 | $447 | $20,600 | $3,700 | $16,900 |
| 2019 | $451 | $20,600 | $3,700 | $16,900 |
| 2018 | $451 | $20,600 | $3,700 | $16,900 |
| 2017 | $450 | $20,600 | $0 | $0 |
| 2016 | $456 | $20,600 | $0 | $0 |
| 2015 | $458 | $20,600 | $0 | $0 |
| 2014 | $429 | $20,600 | $0 | $0 |
Seller's Agent in 2023
Audrey Brodie
First Class Properties
(302) 331-1043
148 Total Sales
Seller's Agent in 2023
Amy Malinky
First Class Properties
(302) 670-6135
47 Total Sales
Buyer's Agent in 2023
Heather Sinclair
EXP Realty, LLC
(302) 983-6553
43 Total Sales
J
Buyer's Agent in 2020
Jamie Compton
Keller Williams Realty Central-Delaware
(302) 399-7686
8 Total Sales
Seller's Agent in 2019
Laurie Ferris
Iron Valley Real Estate at The Beach
(302) 632-0675
77 Total Sales
Buyer's Agent in 2019
Diana Penate
Bryan Realty Group
(302) 228-6218
60 Total Sales
Source: Bright MLS
MLS Number: 1008354652
APN: 1-17-01017-03-0500-000
Disclaimer: Certain information contained herein is derived from information provided by parties other than Homes.com. All information provided is deemed reliable, but is not guaranteed to be accurate and should be independently verified.
![]() The data relating to real estate for sale on this website appears in part through the BRIGHT Internet Data Exchange program, a voluntary cooperative exchange of property listing data between licensed real estate brokerage firms, and is provided by BRIGHT through a licensing agreement.
The data relating to real estate for sale on this website appears in part through the BRIGHT Internet Data Exchange program, a voluntary cooperative exchange of property listing data between licensed real estate brokerage firms, and is provided by BRIGHT through a licensing agreement.
Listing information is from various brokers who participate in the Bright MLS IDX program and not all listings may be visible on the site.
The property information being provided on or through the website is for the personal, non-commercial use of consumers and such information may not be used for any purpose other than to identify prospective properties consumers may be interested in purchasing.
Some properties which appear for sale on the website may no longer be available because they are for instance, under contract, sold or are no longer being offered for sale.
Property information displayed is deemed reliable but is not guaranteed.
Copyright 2025 Bright MLS, Inc.