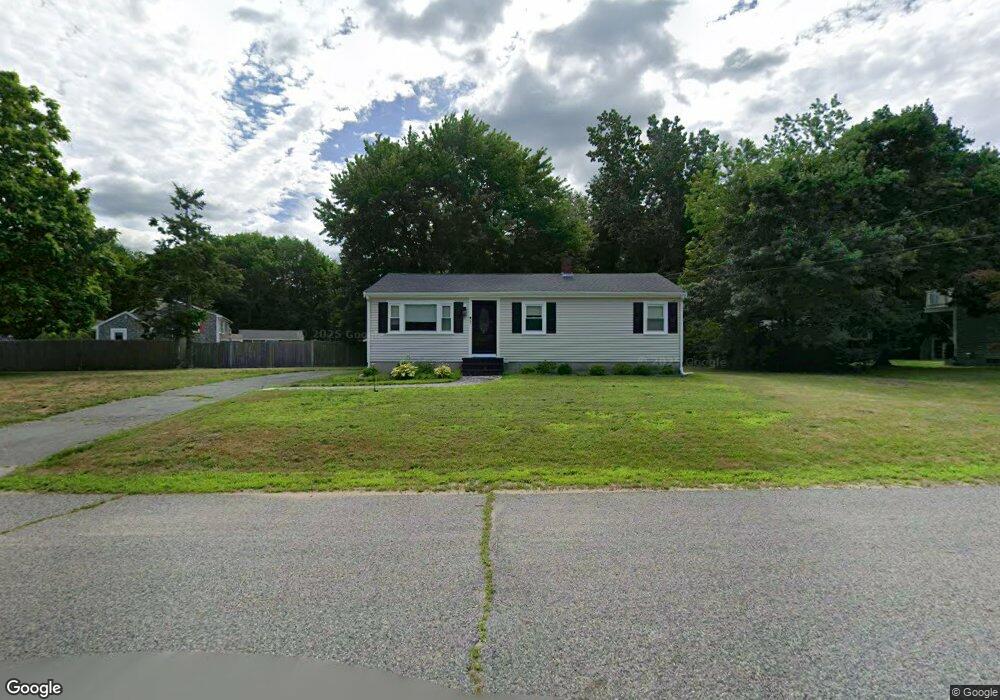
2 Peters Ln Kingston, MA 02364
Estimated Value: $532,000 - $599,000
3
Beds
1
Bath
960
Sq Ft
$584/Sq Ft
Est. Value
About This Home
This home is located at 2 Peters Ln, Kingston, MA 02364 and is currently estimated at $560,854, approximately $584 per square foot. 2 Peters Ln is a home located in Plymouth County with nearby schools including Silver Lake Regional High School, Kingston Elementary School, and Kingston Intermediate School.
Ownership History
Date
Name
Owned For
Owner Type
Purchase Details
Closed on
Apr 21, 2025
Sold by
Macmac Martin
Bought by
Macrae Sara
Current Estimated Value
Home Financials for this Owner
Home Financials are based on the most recent Mortgage that was taken out on this home.
Original Mortgage
$516,678
Outstanding Balance
$514,385
Interest Rate
6.65%
Mortgage Type
FHA
Estimated Equity
$46,469
Purchase Details
Closed on
Nov 7, 2023
Sold by
Messier Charlotte F
Bought by
Macrae Martin and Macrae Sara
Home Financials for this Owner
Home Financials are based on the most recent Mortgage that was taken out on this home.
Original Mortgage
$505,672
Interest Rate
7.19%
Mortgage Type
FHA
Purchase Details
Closed on
Oct 16, 2007
Sold by
Proksell David W and Messier Charlotte F
Bought by
Messier Charlotte F
Create a Home Valuation Report for This Property
The Home Valuation Report is an in-depth analysis detailing your home's value as well as a comparison with similar homes in the area
Home Values in the Area
Average Home Value in this Area
Purchase History
| Date | Buyer | Sale Price | Title Company |
|---|---|---|---|
| Macrae Sara | -- | None Available | |
| Macrae Sara | -- | None Available | |
| Macrae Martin | $515,000 | None Available | |
| Macrae Martin | $515,000 | None Available | |
| Messier Charlotte F | -- | -- | |
| Messier Charlotte F | -- | -- |
Source: Public Records
Mortgage History
| Date | Status | Borrower | Loan Amount |
|---|---|---|---|
| Open | Macrae Sara | $516,678 | |
| Previous Owner | Macrae Martin | $505,672 | |
| Previous Owner | Messier Charlotte F | $150,000 |
Source: Public Records
Tax History Compared to Growth
Tax History
| Year | Tax Paid | Tax Assessment Tax Assessment Total Assessment is a certain percentage of the fair market value that is determined by local assessors to be the total taxable value of land and additions on the property. | Land | Improvement |
|---|---|---|---|---|
| 2025 | $6,062 | $467,400 | $201,500 | $265,900 |
| 2024 | $5,173 | $407,000 | $201,500 | $205,500 |
| 2023 | $4,971 | $372,100 | $201,500 | $170,600 |
| 2022 | $5,135 | $352,200 | $178,700 | $173,500 |
| 2021 | $451 | $295,600 | $164,400 | $131,200 |
| 2020 | $441 | $272,800 | $164,400 | $108,400 |
| 2019 | $459 | $264,200 | $164,400 | $99,800 |
| 2018 | $482 | $255,600 | $164,400 | $91,200 |
| 2017 | $4,094 | $248,100 | $159,600 | $88,500 |
| 2016 | $4,177 | $237,200 | $151,000 | $86,200 |
| 2015 | $4,018 | $237,200 | $151,000 | $86,200 |
| 2014 | $3,923 | $235,200 | $146,000 | $89,200 |
Source: Public Records
Map
Nearby Homes