Estimated Value: $1,536,209
Studio
--
Bath
8,628
Sq Ft
$178/Sq Ft
Est. Value
About This Home
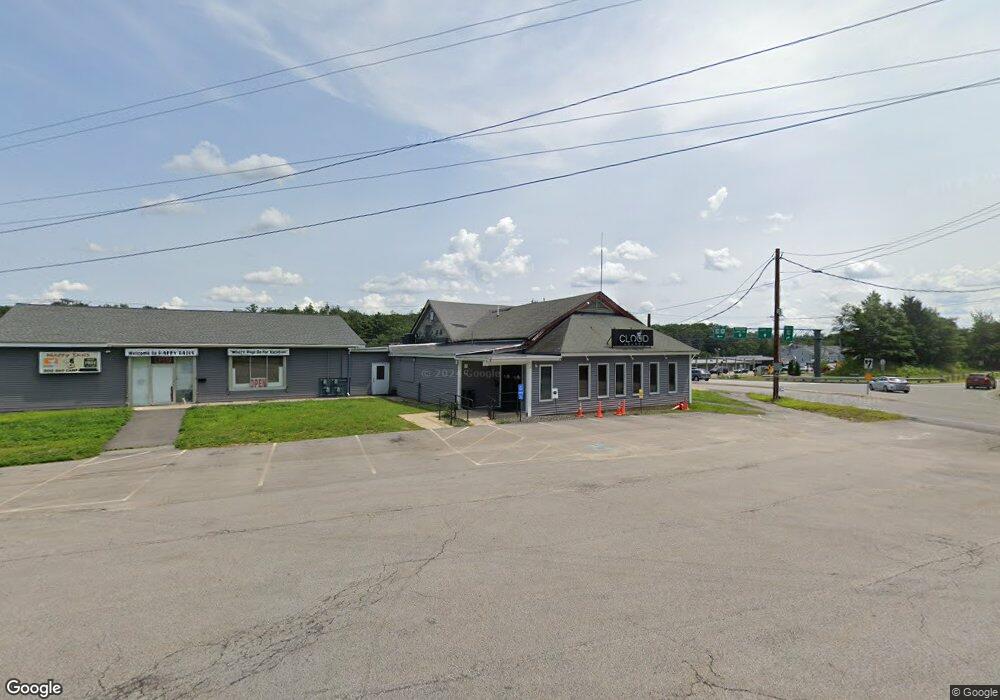
This home is located at 2 Range Rd, Salem, NH 03079 and is currently estimated at $1,536,209, approximately $178 per square foot. 2 Range Rd is a home located in Rockingham County with nearby schools including Mary A. Fisk Elementary School, Woodbury School, and Salem High School.
Ownership History
Date
Name
Owned For
Owner Type
Purchase Details
Closed on
Sep 30, 1996
Sold by
Carlson Paul A and Carlson Lorna M
Bought by
Canobie Corners Mgmt S
Current Estimated Value
Home Financials for this Owner
Home Financials are based on the most recent Mortgage that was taken out on this home.
Original Mortgage
$356,500
Interest Rate
7.83%
Mortgage Type
Commercial
Create a Home Valuation Report for This Property
The Home Valuation Report is an in-depth analysis detailing your home's value as well as a comparison with similar homes in the area
Purchase History
| Date | Buyer | Sale Price | Title Company |
|---|---|---|---|
| Canobie Corners Mgmt S | $398,000 | -- |
Source: Public Records
Mortgage History
| Date | Status | Borrower | Loan Amount |
|---|---|---|---|
| Open | Canobie Corners Mgmt S | $225,000 | |
| Closed | Canobie Corners Mgmt S | $356,500 |
Source: Public Records
Tax History
| Year | Tax Paid | Tax Assessment Tax Assessment Total Assessment is a certain percentage of the fair market value that is determined by local assessors to be the total taxable value of land and additions on the property. | Land | Improvement |
|---|---|---|---|---|
| 2024 | $13,760 | $781,800 | $422,800 | $359,000 |
| 2023 | $13,259 | $781,800 | $422,800 | $359,000 |
| 2022 | $12,548 | $781,800 | $422,800 | $359,000 |
| 2021 | $12,493 | $781,800 | $422,800 | $359,000 |
| 2020 | $14,381 | $653,100 | $402,800 | $250,300 |
| 2019 | $14,355 | $653,100 | $402,800 | $250,300 |
| 2018 | $14,113 | $653,100 | $402,800 | $250,300 |
| 2017 | $14,609 | $701,000 | $402,800 | $298,200 |
| 2016 | $14,321 | $701,000 | $402,800 | $298,200 |
| 2015 | $14,171 | $662,500 | $373,600 | $288,900 |
| 2014 | $13,773 | $662,500 | $373,600 | $288,900 |
| 2013 | $13,968 | $682,700 | $373,600 | $309,100 |
Source: Public Records
Map
Nearby Homes
- 144 N Policy St
- 10 Harris Rd
- 27 London Rd
- 29 London Rd
- 5 Johnson St
- 11 Sullivan Ct
- 108 S Shore Rd
- 45 Trails Edge Rd
- 55A Millville Cir
- 6 Chadwick Cir
- 4 Therriault Ave
- 53 Trails Edge Rd
- 55 Trails Edge Rd
- 30 Main St
- 24 Rockingham Rd
- 54 Enterprise Dr
- 10 Millville St
- 8 Alta Ave
- 15 Briar Ave
- 3 Evergreen Way Unit End unit
Your Personal Tour Guide
Ask me questions while you tour the home.