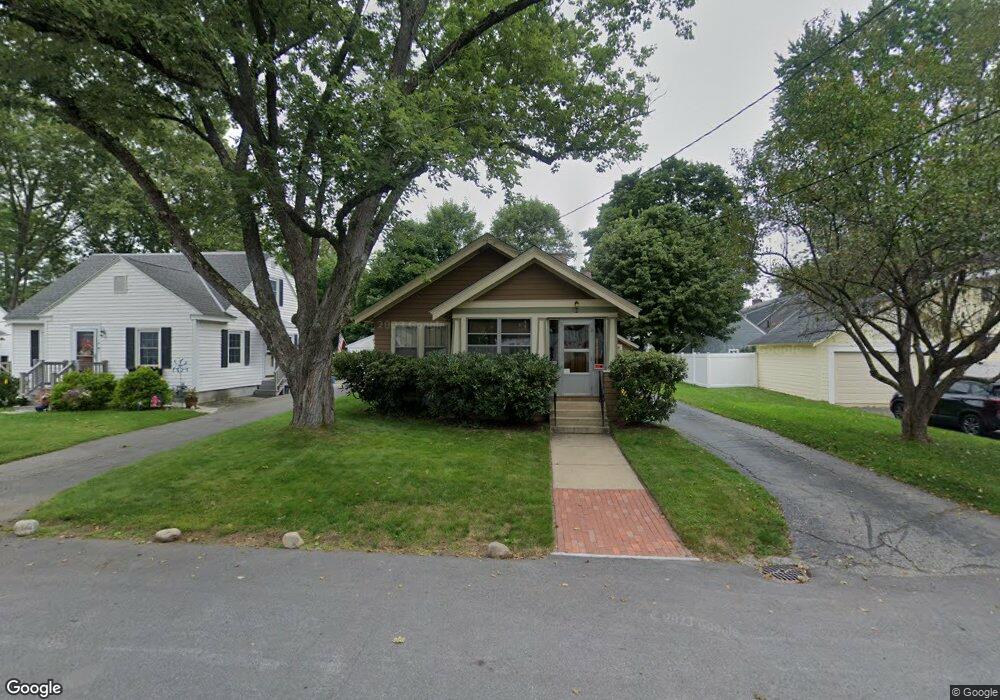
2 Roosevelt Ave Concord, NH 03301
South End NeighborhoodEstimated Value: $441,366 - $523,000
3
Beds
2
Baths
1,731
Sq Ft
$271/Sq Ft
Est. Value
About This Home
This home is located at 2 Roosevelt Ave, Concord, NH 03301 and is currently estimated at $468,592, approximately $270 per square foot. 2 Roosevelt Ave is a home located in Merrimack County with nearby schools including Abbot-Downing School, Rundlett Middle School, and Concord High School.
Ownership History
Date
Name
Owned For
Owner Type
Purchase Details
Closed on
Jun 30, 2010
Sold by
Potter Kenneth E and Potter Rebecca M
Bought by
Czysz Jennifer L and Czysz Aaron M
Current Estimated Value
Home Financials for this Owner
Home Financials are based on the most recent Mortgage that was taken out on this home.
Original Mortgage
$209,000
Outstanding Balance
$137,827
Interest Rate
4.88%
Mortgage Type
Purchase Money Mortgage
Estimated Equity
$330,765
Create a Home Valuation Report for This Property
The Home Valuation Report is an in-depth analysis detailing your home's value as well as a comparison with similar homes in the area
Home Values in the Area
Average Home Value in this Area
Purchase History
| Date | Buyer | Sale Price | Title Company |
|---|---|---|---|
| Czysz Jennifer L | $220,000 | -- |
Source: Public Records
Mortgage History
| Date | Status | Borrower | Loan Amount |
|---|---|---|---|
| Open | Czysz Jennifer L | $209,000 |
Source: Public Records
Tax History
| Year | Tax Paid | Tax Assessment Tax Assessment Total Assessment is a certain percentage of the fair market value that is determined by local assessors to be the total taxable value of land and additions on the property. | Land | Improvement |
|---|---|---|---|---|
| 2025 | $8,398 | $288,500 | $118,800 | $169,700 |
| 2024 | $7,989 | $288,500 | $118,800 | $169,700 |
| 2023 | $7,749 | $288,500 | $118,800 | $169,700 |
| 2022 | $7,469 | $288,500 | $118,800 | $169,700 |
| 2021 | $7,167 | $285,300 | $118,800 | $166,500 |
| 2020 | $6,717 | $251,000 | $93,500 | $157,500 |
| 2019 | $6,392 | $230,100 | $97,200 | $132,900 |
| 2018 | $6,611 | $234,500 | $97,500 | $137,000 |
| 2017 | $6,515 | $230,700 | $97,500 | $133,200 |
| 2016 | $6,234 | $225,300 | $95,700 | $129,600 |
| 2015 | $4,580 | $217,700 | $103,800 | $113,900 |
| 2014 | $5,837 | $217,700 | $103,800 | $113,900 |
| 2013 | -- | $213,700 | $103,800 | $109,900 |
| 2012 | -- | $211,000 | $109,400 | $101,600 |
Source: Public Records
Map
Nearby Homes
- 0 South St Unit 4969509
- 47 Noyes St
- 40 Nivelle St
- 335 S Main St
- 289 South St
- 47 South St
- 58 S State St
- 30 Longmeadow Dr
- 7-9 Myrtle St
- 25 N Spring St
- 5 Holly Cir
- 5 Windchime Dr
- 21 Fairfield Dr
- 22 Fairfield Dr
- 20 Fairfield Dr
- 4 Bow Center Rd Unit F2
- 19 Grappone Dr
- 26 Jonathan Ln
- 30 Penacook St
- 28 Stevens Dr
Your Personal Tour Guide
Ask me questions while you tour the home.