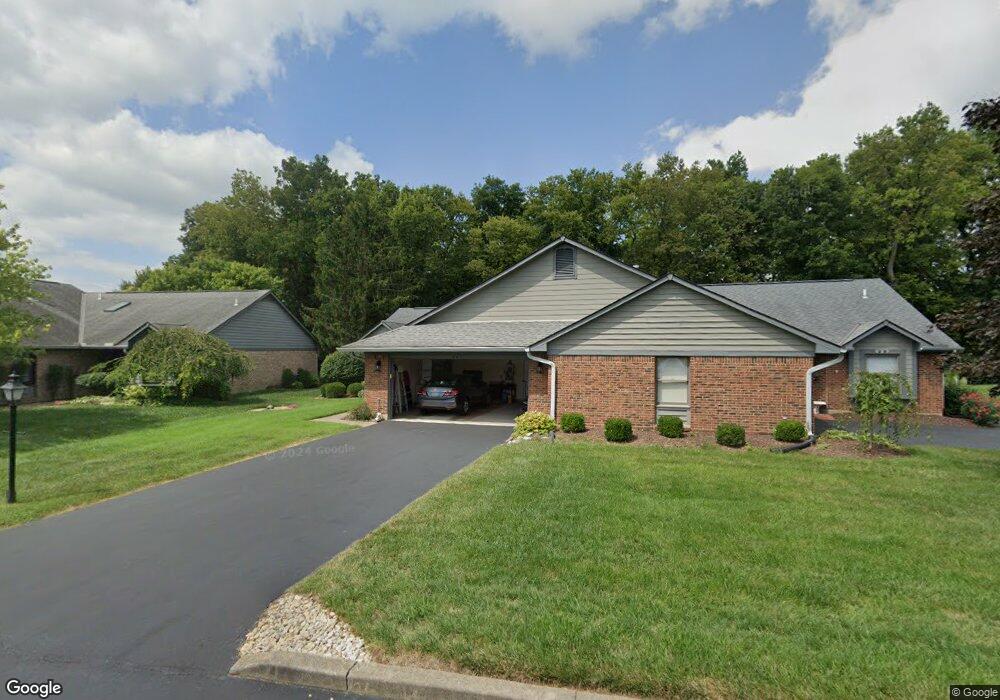
2 Shaker Run Rd Unit A Lebanon, OH 45036
Estimated Value: $286,146 - $306,000
2
Beds
2
Baths
1,355
Sq Ft
$218/Sq Ft
Est. Value
About This Home
This home is located at 2 Shaker Run Rd Unit A, Lebanon, OH 45036 and is currently estimated at $295,787, approximately $218 per square foot. 2 Shaker Run Rd Unit A is a home located in Warren County with nearby schools including Bowman Primary School, Berry Intermediate School, and Donovan Elementary School.
Ownership History
Date
Name
Owned For
Owner Type
Purchase Details
Closed on
Jul 1, 2025
Sold by
Osullivan Tina and Stephenson Tina
Bought by
Stephenson Barry W and Stephenson Catherine A
Current Estimated Value
Purchase Details
Closed on
Mar 6, 2025
Sold by
Shutt Jeannette
Bought by
Sousa Angela and Osullivan Tina
Purchase Details
Closed on
Feb 18, 2004
Sold by
Jones Terry Lee and Smith Dianne Lynn
Bought by
Shutt Jeannette
Purchase Details
Closed on
Aug 8, 1994
Sold by
Est Jewell Byrd
Bought by
Jones Betty K
Purchase Details
Closed on
Mar 5, 1991
Sold by
Byrd Byrd and Byrd Merritt
Bought by
Jewell Byrd and Jewell M.
Purchase Details
Closed on
Feb 20, 1990
Sold by
Oberer Development Co
Bought by
Byrd Byrd and Byrd Merritt
Purchase Details
Closed on
Jul 27, 1988
Sold by
Oberer Development Co
Bought by
Oberer Development Co
Create a Home Valuation Report for This Property
The Home Valuation Report is an in-depth analysis detailing your home's value as well as a comparison with similar homes in the area
Home Values in the Area
Average Home Value in this Area
Purchase History
| Date | Buyer | Sale Price | Title Company |
|---|---|---|---|
| Stephenson Barry W | -- | None Listed On Document | |
| Sousa Angela | $290,000 | None Listed On Document | |
| Shutt Jeannette | $128,000 | -- | |
| Jones Betty K | $106,900 | -- | |
| Jewell Byrd | -- | -- | |
| Byrd Byrd | $97,000 | -- | |
| Oberer Development Co | -- | -- |
Source: Public Records
Tax History
| Year | Tax Paid | Tax Assessment Tax Assessment Total Assessment is a certain percentage of the fair market value that is determined by local assessors to be the total taxable value of land and additions on the property. | Land | Improvement |
|---|---|---|---|---|
| 2025 | $2,857 | $78,610 | $19,250 | $59,360 |
| 2024 | $2,857 | $78,610 | $19,250 | $59,360 |
| 2023 | $2,530 | $63,490 | $10,762 | $52,727 |
| 2022 | $2,637 | $63,490 | $10,763 | $52,728 |
| 2021 | $2,492 | $63,490 | $10,763 | $52,728 |
| 2020 | $2,311 | $51,618 | $8,750 | $42,868 |
| 2019 | $2,322 | $51,618 | $8,750 | $42,868 |
| 2018 | $1,990 | $51,618 | $8,750 | $42,868 |
| 2017 | $1,977 | $46,963 | $8,092 | $38,871 |
| 2016 | $2,039 | $46,963 | $8,092 | $38,871 |
| 2015 | $2,054 | $46,963 | $8,092 | $38,871 |
| 2014 | $1,967 | $43,890 | $7,560 | $36,330 |
| 2013 | $1,893 | $50,770 | $8,750 | $42,020 |
Source: Public Records
Map
Nearby Homes
- 19 Hathaway Commons
- 427 Brandon Dunes Unit 12-304
- 427 Brandon Dunes
- 0 Lakeside Dr Unit 950036
- 0 Lakeside Dr Unit 1865049
- 0 Columbus Ave Unit 1869651
- 531 Quail Ct
- 850 Sand Trap Place
- 938 Southline Dr
- 309 Virginia Ct
- 1 Owlwood Ct
- 00 Owlwood Ct
- 26 Summit St
- 355 Summit St
- 201 Summit St
- 1 Dryhill Ct
- 37 Desales Ave
- 816 Hartz Dr
- 517 E Warren St
- 815 Hartz Dr
- 2 Shaker Run Rd
- 2 Shaker Run Rd
- 2 Shaker Run Rd Unit B
- 2 Shaker Run Rd Unit 4395-2
- 3A Shaker Run Rd
- 3 Shaker Run Rd
- 3 Shaker Run Rd
- 3 Shaker Run Rd Unit A
- 10 Montclair Ct Unit A
- 10 Montclair Ct Unit B
- 10 Montclair Ct
- B Montclaire Ct
- 17 Montclair Ct
- 17 Montclair Ct Unit B
- 4 Shaker Run Rd
- 4 Shaker Run Rd
- 4 Shaker Run Rd Unit B
- 4 Shaker Run Rd Unit A
- 4 Shaker Run Rd Unit 4395-4
- 9 Claridge Ct Unit A
Your Personal Tour Guide
Ask me questions while you tour the home.