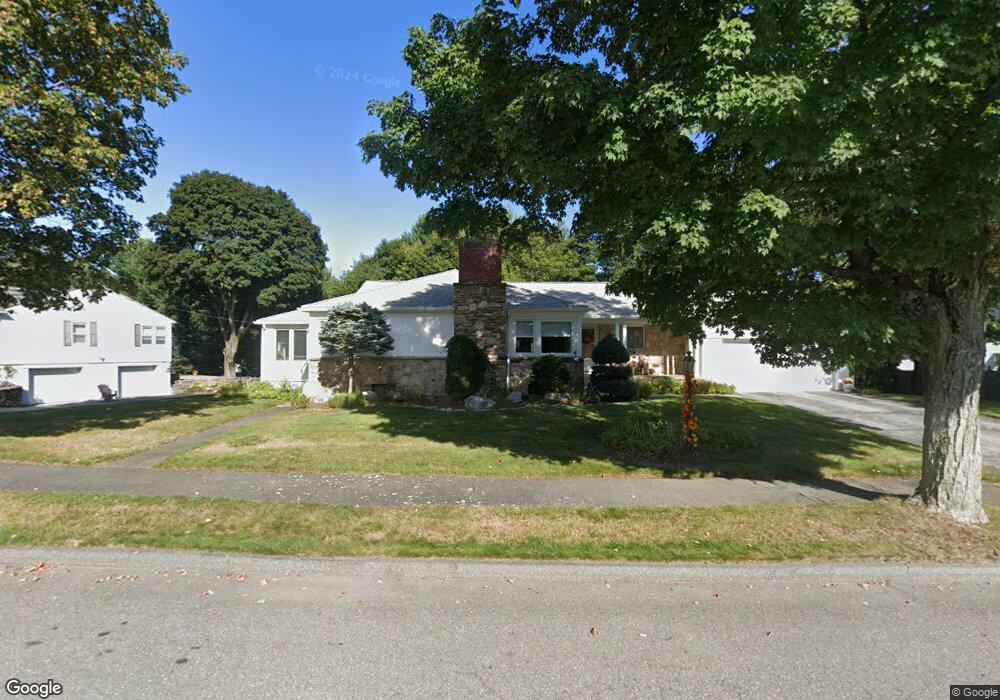
2 Southwood Rd Worcester, MA 01609
Salisbury Street NeighborhoodEstimated Value: $535,810 - $609,000
3
Beds
3
Baths
1,852
Sq Ft
$307/Sq Ft
Est. Value
About This Home
This home is located at 2 Southwood Rd, Worcester, MA 01609 and is currently estimated at $567,703, approximately $306 per square foot. 2 Southwood Rd is a home located in Worcester County with nearby schools including Chandler Magnet, Jacob Hiatt Magnet School, and Flagg Street School.
Ownership History
Date
Name
Owned For
Owner Type
Purchase Details
Closed on
Feb 19, 2019
Sold by
Goldthwiate Construction
Bought by
Junly Doan Eric and Junly Nhan
Current Estimated Value
Home Financials for this Owner
Home Financials are based on the most recent Mortgage that was taken out on this home.
Original Mortgage
$277,936
Outstanding Balance
$244,356
Interest Rate
4.5%
Mortgage Type
New Conventional
Estimated Equity
$323,347
Create a Home Valuation Report for This Property
The Home Valuation Report is an in-depth analysis detailing your home's value as well as a comparison with similar homes in the area
Home Values in the Area
Average Home Value in this Area
Purchase History
| Date | Buyer | Sale Price | Title Company |
|---|---|---|---|
| Junly Doan Eric | $347,420 | -- |
Source: Public Records
Mortgage History
| Date | Status | Borrower | Loan Amount |
|---|---|---|---|
| Open | Junly Doan Eric | $277,936 |
Source: Public Records
Tax History Compared to Growth
Tax History
| Year | Tax Paid | Tax Assessment Tax Assessment Total Assessment is a certain percentage of the fair market value that is determined by local assessors to be the total taxable value of land and additions on the property. | Land | Improvement |
|---|---|---|---|---|
| 2025 | $6,170 | $467,800 | $119,100 | $348,700 |
| 2024 | $6,006 | $436,800 | $119,100 | $317,700 |
| 2023 | $6,106 | $425,800 | $103,500 | $322,300 |
| 2022 | $5,439 | $357,600 | $82,800 | $274,800 |
| 2021 | $5,605 | $344,300 | $66,300 | $278,000 |
| 2020 | $5,335 | $313,800 | $66,200 | $247,600 |
| 2019 | $5,204 | $289,100 | $59,800 | $229,300 |
| 2018 | $4,987 | $263,700 | $59,800 | $203,900 |
| 2017 | $5,068 | $263,700 | $59,800 | $203,900 |
| 2016 | $5,095 | $247,200 | $44,600 | $202,600 |
| 2015 | $4,961 | $247,200 | $44,600 | $202,600 |
| 2014 | $4,830 | $247,200 | $44,600 | $202,600 |
Source: Public Records
Map
Nearby Homes