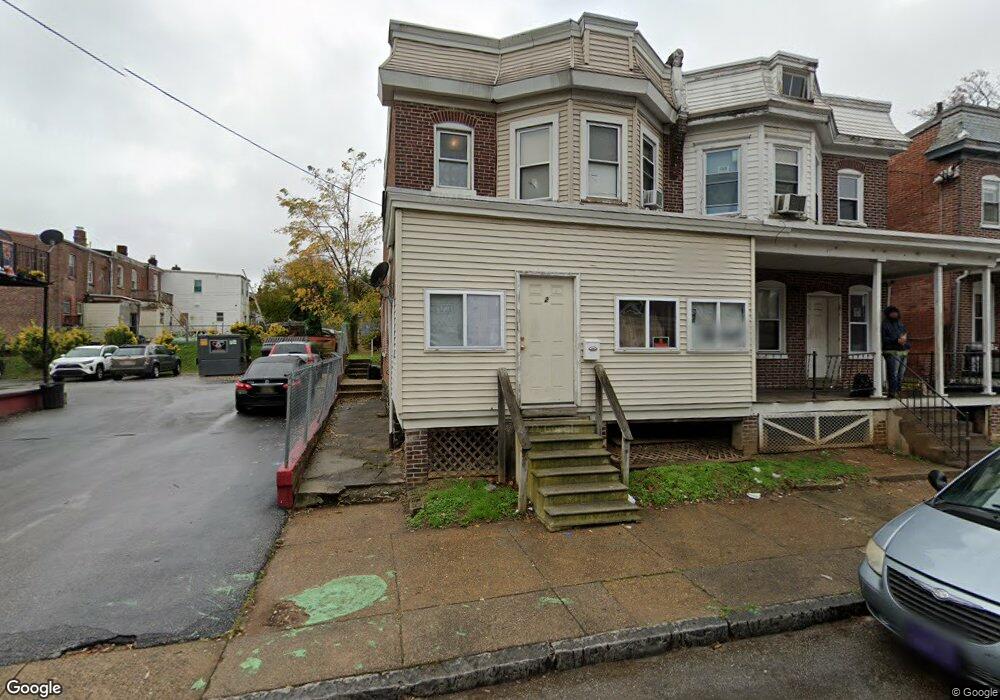
2 W 27th St Wilmington, DE 19802
North Brandywine NeighborhoodEstimated Value: $155,446 - $250,000
3
Beds
1
Bath
1,200
Sq Ft
$171/Sq Ft
Est. Value
About This Home
This home is located at 2 W 27th St, Wilmington, DE 19802 and is currently estimated at $205,362, approximately $171 per square foot. 2 W 27th St is a home with nearby schools including Evan G. Shortlidge Academy, The John Dickinson School, and Skyline Middle School.
Ownership History
Date
Name
Owned For
Owner Type
Purchase Details
Closed on
Dec 6, 2023
Sold by
Buckanavage Evan
Bought by
Stony Crest Property Management Llc
Current Estimated Value
Home Financials for this Owner
Home Financials are based on the most recent Mortgage that was taken out on this home.
Original Mortgage
$137,600
Outstanding Balance
$135,427
Interest Rate
7.76%
Mortgage Type
New Conventional
Estimated Equity
$69,935
Purchase Details
Closed on
Apr 21, 1992
Bought by
Johnson Booker and Johnson Claire B
Create a Home Valuation Report for This Property
The Home Valuation Report is an in-depth analysis detailing your home's value as well as a comparison with similar homes in the area
Home Values in the Area
Average Home Value in this Area
Purchase History
| Date | Buyer | Sale Price | Title Company |
|---|---|---|---|
| Stony Crest Property Management Llc | -- | None Listed On Document | |
| Johnson Booker | $22,800 | -- |
Source: Public Records
Mortgage History
| Date | Status | Borrower | Loan Amount |
|---|---|---|---|
| Open | Stony Crest Property Management Llc | $137,600 |
Source: Public Records
Tax History Compared to Growth
Tax History
| Year | Tax Paid | Tax Assessment Tax Assessment Total Assessment is a certain percentage of the fair market value that is determined by local assessors to be the total taxable value of land and additions on the property. | Land | Improvement |
|---|---|---|---|---|
| 2024 | $702 | $22,500 | $2,800 | $19,700 |
| 2023 | $610 | $22,500 | $2,800 | $19,700 |
| 2022 | $613 | $22,500 | $2,800 | $19,700 |
| 2021 | $612 | $22,500 | $2,800 | $19,700 |
| 2020 | $615 | $22,500 | $2,800 | $19,700 |
| 2019 | $1,068 | $22,500 | $2,800 | $19,700 |
| 2018 | $613 | $22,500 | $2,800 | $19,700 |
| 2017 | $612 | $22,500 | $2,800 | $19,700 |
| 2016 | $580 | $22,500 | $2,800 | $19,700 |
| 2015 | $953 | $22,500 | $2,800 | $19,700 |
| 2014 | $905 | $22,500 | $2,800 | $19,700 |
Source: Public Records
Map
Nearby Homes