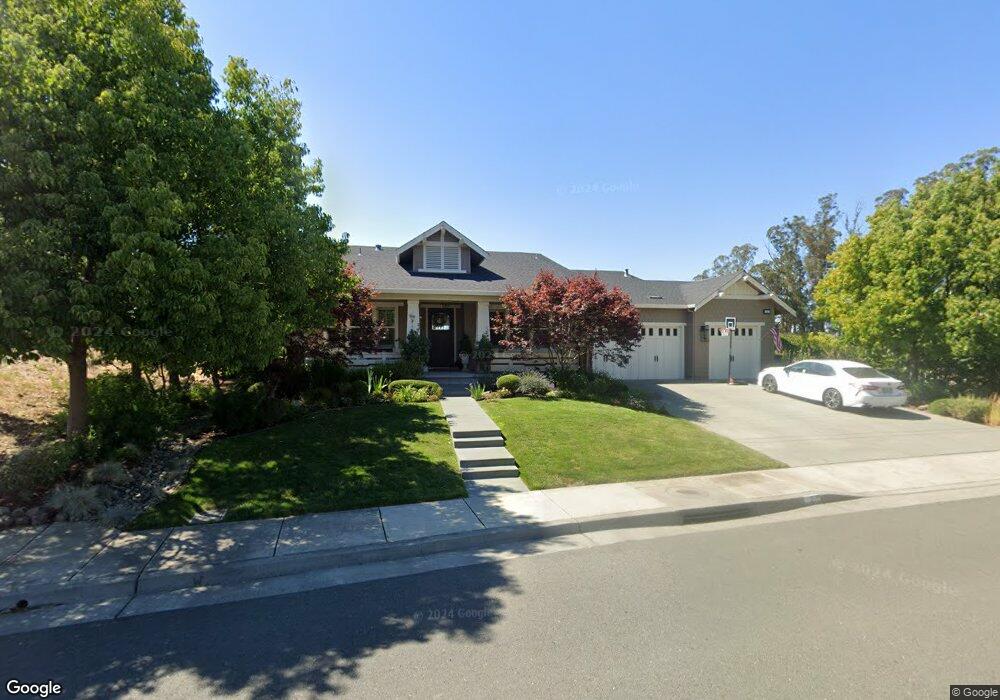
2 W Haven Way Petaluma, CA 94952
Western Petaluma NeighborhoodEstimated Value: $1,784,858 - $2,128,000
4
Beds
4
Baths
3,872
Sq Ft
$520/Sq Ft
Est. Value
About This Home
This home is located at 2 W Haven Way, Petaluma, CA 94952 and is currently estimated at $2,013,965, approximately $520 per square foot. 2 W Haven Way is a home located in Sonoma County with nearby schools including Wilson Elementary School, Petaluma Junior High School, and Petaluma High School.
Ownership History
Date
Name
Owned For
Owner Type
Purchase Details
Closed on
Jan 16, 2015
Sold by
Wheeler Robb M
Bought by
Wheeler Robb M and Wheeler Anne
Current Estimated Value
Home Financials for this Owner
Home Financials are based on the most recent Mortgage that was taken out on this home.
Original Mortgage
$912,000
Outstanding Balance
$699,325
Interest Rate
3.87%
Mortgage Type
New Conventional
Estimated Equity
$1,314,640
Purchase Details
Closed on
Mar 19, 2014
Sold by
Oppenheim Dr Bruce C and Harrison Oppenheim J
Bought by
Wheeler Robb M
Home Financials for this Owner
Home Financials are based on the most recent Mortgage that was taken out on this home.
Original Mortgage
$912,000
Interest Rate
4.18%
Mortgage Type
New Conventional
Purchase Details
Closed on
Aug 28, 2007
Sold by
Rockridge Pointe Investors Llc
Bought by
Oppenheim Bruce C and Harrison Oppenheim J
Create a Home Valuation Report for This Property
The Home Valuation Report is an in-depth analysis detailing your home's value as well as a comparison with similar homes in the area
Home Values in the Area
Average Home Value in this Area
Purchase History
| Date | Buyer | Sale Price | Title Company |
|---|---|---|---|
| Wheeler Robb M | -- | None Available | |
| Wheeler Robb M | $1,140,000 | Fidelity National Title Co | |
| Oppenheim Bruce C | $1,155,000 | First American Title Company |
Source: Public Records
Mortgage History
| Date | Status | Borrower | Loan Amount |
|---|---|---|---|
| Open | Wheeler Robb M | $912,000 | |
| Closed | Wheeler Robb M | $912,000 |
Source: Public Records
Tax History Compared to Growth
Tax History
| Year | Tax Paid | Tax Assessment Tax Assessment Total Assessment is a certain percentage of the fair market value that is determined by local assessors to be the total taxable value of land and additions on the property. | Land | Improvement |
|---|---|---|---|---|
| 2025 | $14,884 | $1,397,472 | $558,987 | $838,485 |
| 2024 | $14,884 | $1,370,072 | $548,027 | $822,045 |
| 2023 | $14,884 | $1,343,209 | $537,282 | $805,927 |
| 2022 | $14,575 | $1,316,873 | $526,748 | $790,125 |
| 2021 | $14,247 | $1,291,053 | $516,420 | $774,633 |
| 2020 | $14,359 | $1,277,816 | $511,125 | $766,691 |
| 2019 | $14,130 | $1,252,761 | $501,103 | $751,658 |
| 2018 | $14,053 | $1,228,198 | $491,278 | $736,920 |
| 2017 | $13,817 | $1,204,117 | $481,646 | $722,471 |
| 2016 | $13,395 | $1,180,507 | $472,202 | $708,305 |
| 2015 | $13,072 | $1,162,776 | $465,110 | $697,666 |
| 2014 | $10,525 | $926,000 | $445,000 | $481,000 |
Source: Public Records
Map
Nearby Homes