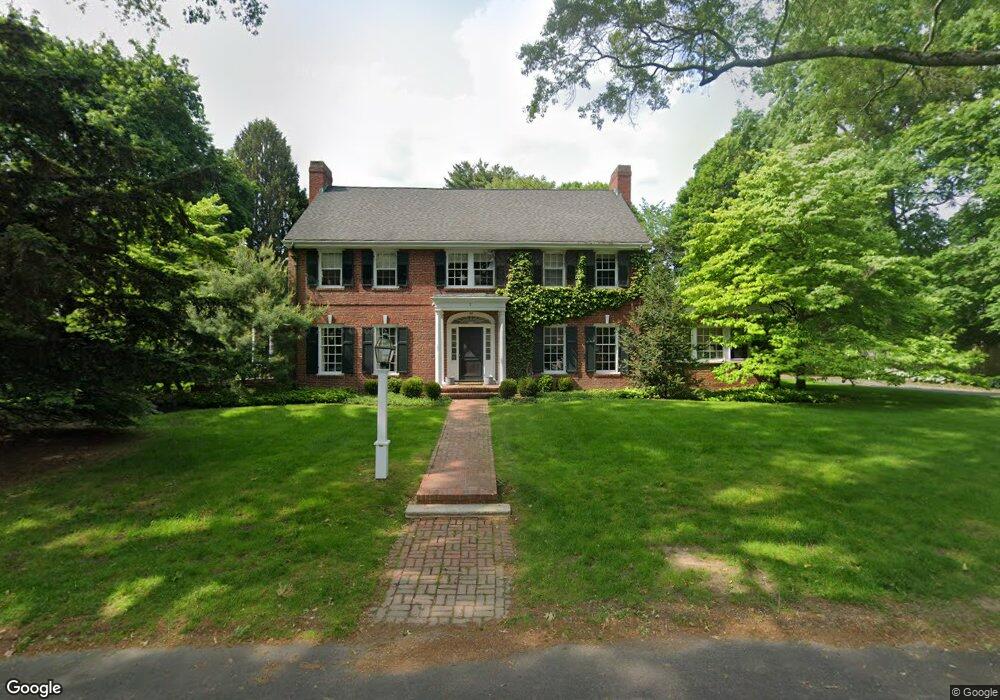
2 Wampatuck Rd Dedham, MA 02026
Dexter NeighborhoodEstimated Value: $1,837,000 - $3,203,000
6
Beds
4
Baths
3,352
Sq Ft
$654/Sq Ft
Est. Value
About This Home
This home is located at 2 Wampatuck Rd, Dedham, MA 02026 and is currently estimated at $2,191,371, approximately $653 per square foot. 2 Wampatuck Rd is a home located in Norfolk County with nearby schools including Riverdale Elementary School, Dedham Middle School, and Dedham High School.
Ownership History
Date
Name
Owned For
Owner Type
Purchase Details
Closed on
Sep 7, 1995
Sold by
Wright Whitney
Bought by
Beckwith David S and Beckwith Amy D
Current Estimated Value
Home Financials for this Owner
Home Financials are based on the most recent Mortgage that was taken out on this home.
Original Mortgage
$580,000
Interest Rate
7.8%
Mortgage Type
Purchase Money Mortgage
Create a Home Valuation Report for This Property
The Home Valuation Report is an in-depth analysis detailing your home's value as well as a comparison with similar homes in the area
Home Values in the Area
Average Home Value in this Area
Purchase History
| Date | Buyer | Sale Price | Title Company |
|---|---|---|---|
| Beckwith David S | $725,000 | -- |
Source: Public Records
Mortgage History
| Date | Status | Borrower | Loan Amount |
|---|---|---|---|
| Closed | Beckwith David S | $580,000 |
Source: Public Records
Tax History
| Year | Tax Paid | Tax Assessment Tax Assessment Total Assessment is a certain percentage of the fair market value that is determined by local assessors to be the total taxable value of land and additions on the property. | Land | Improvement |
|---|---|---|---|---|
| 2025 | $21,978 | $1,741,500 | $555,700 | $1,185,800 |
| 2024 | $19,928 | $1,594,200 | $482,500 | $1,111,700 |
| 2023 | $17,676 | $1,376,600 | $417,300 | $959,300 |
| 2022 | $16,757 | $1,255,200 | $417,300 | $837,900 |
| 2021 | $15,356 | $1,123,300 | $378,200 | $745,100 |
| 2020 | $15,331 | $1,117,400 | $381,000 | $736,400 |
| 2019 | $15,418 | $1,089,600 | $401,500 | $688,100 |
| 2018 | $16,353 | $1,123,900 | $435,800 | $688,100 |
| 2017 | $14,642 | $992,000 | $342,400 | $649,600 |
| 2016 | $15,722 | $1,015,000 | $299,400 | $715,600 |
| 2015 | $18,090 | $1,139,900 | $394,800 | $745,100 |
| 2014 | $17,674 | $1,099,100 | $394,800 | $704,300 |
Source: Public Records
Map
Nearby Homes
- 37 Horrigan Dr Unit 1
- 57 Horrigan Dr Unit 3
- 66 Horrigan Dr Unit 25
- 80 Horrigan Dr Unit 24
- 86 Horrigan Dr Unit 23
- 87 Horrigan Dr Unit 8
- 570 Bridge St
- 47 Village Ave Unit 203
- 20-35 Shuttleworth Place
- 20 Shuttleworth Place
- 35 Shuttleworth Place
- 47 Bemis Rd
- 1133 High
- 44 Court St
- 55 Church St Unit 1
- 46 Church St
- 92 Old River Place
- 441 Washington St Unit 301
- 441 Washington St Unit 302
- 262 Meadowbrook Rd
- 25 Allindale Way
- 1 Wampatuck Rd
- 3 Wampatuck Rd
- 188 Village Ave
- 208 Village Ave
- 194 Village Ave
- 4 Stonewood Place Unit 102
- 6 Wampatuck Rd
- 219 Lowder St
- 199 Lowder St
- 14 Allindale Way
- 191 Lowder St
- 930 High St
- 235 Lowder St
- 214 Village Ave
- 214 Village Ave Unit 214
- 31 Wampatuck Rd
- 216 Village Ave
- 216 Village Ave Unit 2
- 950 High St
Your Personal Tour Guide
Ask me questions while you tour the home.