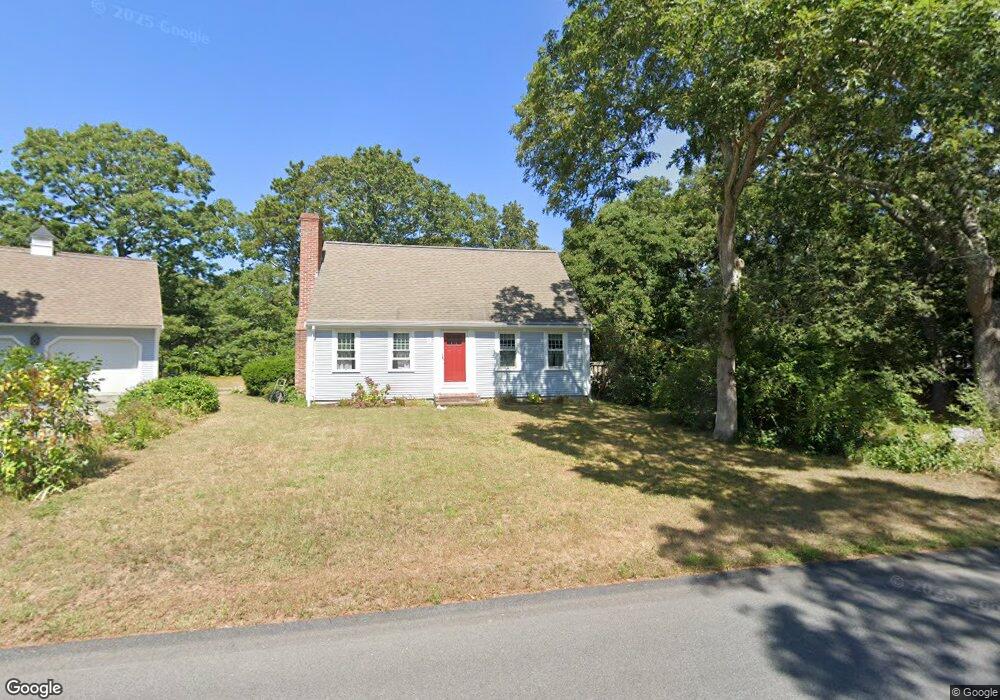
2 Woodridge Rd Orleans, MA 02653
Estimated Value: $568,000 - $915,000
3
Beds
2
Baths
1,456
Sq Ft
$469/Sq Ft
Est. Value
About This Home
This home is located at 2 Woodridge Rd, Orleans, MA 02653 and is currently estimated at $682,548, approximately $468 per square foot. 2 Woodridge Rd is a home located in Barnstable County with nearby schools including Orleans Elementary School, Nauset Regional Middle School, and Nauset Regional High School.
Ownership History
Date
Name
Owned For
Owner Type
Purchase Details
Closed on
Jul 25, 2025
Sold by
Jane T Greene Ft and Ventura
Bought by
Boyar Mathias and Boyar Elizabeth V
Current Estimated Value
Home Financials for this Owner
Home Financials are based on the most recent Mortgage that was taken out on this home.
Original Mortgage
$504,000
Outstanding Balance
$502,714
Interest Rate
6.84%
Mortgage Type
New Conventional
Estimated Equity
$179,834
Purchase Details
Closed on
May 30, 2019
Sold by
Greene Jane T
Bought by
Jane T Greene Ft and Ventura
Purchase Details
Closed on
Oct 6, 1997
Sold by
Antonez Nancy A
Bought by
Bucchianeri Kenneth M and Bucchianeri Nanci L
Home Financials for this Owner
Home Financials are based on the most recent Mortgage that was taken out on this home.
Original Mortgage
$99,000
Interest Rate
7.41%
Mortgage Type
Purchase Money Mortgage
Purchase Details
Closed on
Jan 28, 1971
Bought by
Greene Kenneth A and Greene Jane T
Create a Home Valuation Report for This Property
The Home Valuation Report is an in-depth analysis detailing your home's value as well as a comparison with similar homes in the area
Home Values in the Area
Average Home Value in this Area
Purchase History
| Date | Buyer | Sale Price | Title Company |
|---|---|---|---|
| Boyar Mathias | $560,000 | -- | |
| Boyar Mathias | $560,000 | -- | |
| Jane T Greene Ft | -- | -- | |
| Jane T Greene Ft | -- | -- | |
| Greene Jane T | -- | -- | |
| Greene Jane T | -- | -- | |
| Bucchianeri Kenneth M | $133,000 | -- | |
| Bucchianeri Kenneth M | $133,000 | -- | |
| Greene Kenneth A | $5,500 | -- |
Source: Public Records
Mortgage History
| Date | Status | Borrower | Loan Amount |
|---|---|---|---|
| Open | Boyar Mathias | $504,000 | |
| Closed | Boyar Mathias | $504,000 | |
| Previous Owner | Greene Kenneth A | $99,000 |
Source: Public Records
Tax History
| Year | Tax Paid | Tax Assessment Tax Assessment Total Assessment is a certain percentage of the fair market value that is determined by local assessors to be the total taxable value of land and additions on the property. | Land | Improvement |
|---|---|---|---|---|
| 2025 | $3,559 | $570,400 | $216,500 | $353,900 |
| 2024 | $3,515 | $548,300 | $212,200 | $336,100 |
| 2023 | $3,163 | $507,700 | $196,500 | $311,200 |
| 2022 | $2,958 | $410,900 | $190,500 | $220,400 |
| 2021 | $2,931 | $373,900 | $188,100 | $185,800 |
| 2020 | $2,722 | $360,000 | $177,600 | $182,400 |
| 2019 | $2,603 | $351,700 | $172,700 | $179,000 |
| 2018 | $2,232 | $336,600 | $169,400 | $167,200 |
| 2017 | $2,084 | $329,200 | $169,400 | $159,800 |
| 2016 | $2,098 | $324,700 | $168,000 | $156,700 |
| 2015 | $2,034 | $316,900 | $164,700 | $152,200 |
Source: Public Records
Map
Nearby Homes
- 507 S Orleans Rd
- 0 Pine Grove Rd Unit 73397945
- 0 Pine Grove Rd Unit 22505629
- 34 Lake Dr
- 449 S Orleans Rd
- 2 Monomoy Ln
- 8 Monomoy Ln
- 14 Bambi Way
- 4 Monomoy Ln
- 6 Monomoy Ln
- 645 S Orleans Rd
- 34 Ridgewood Rd
- 11 Little Marsh Ln
- 32 Areys Ln
- 22 Pilgrim Lake Terrace
- 7 Lockwood Ln
- 33 Pine Orchard Rd
- 15 Morgans Way
- 15 Morgan's Way
- 142 Monument Rd
Your Personal Tour Guide
Ask me questions while you tour the home.