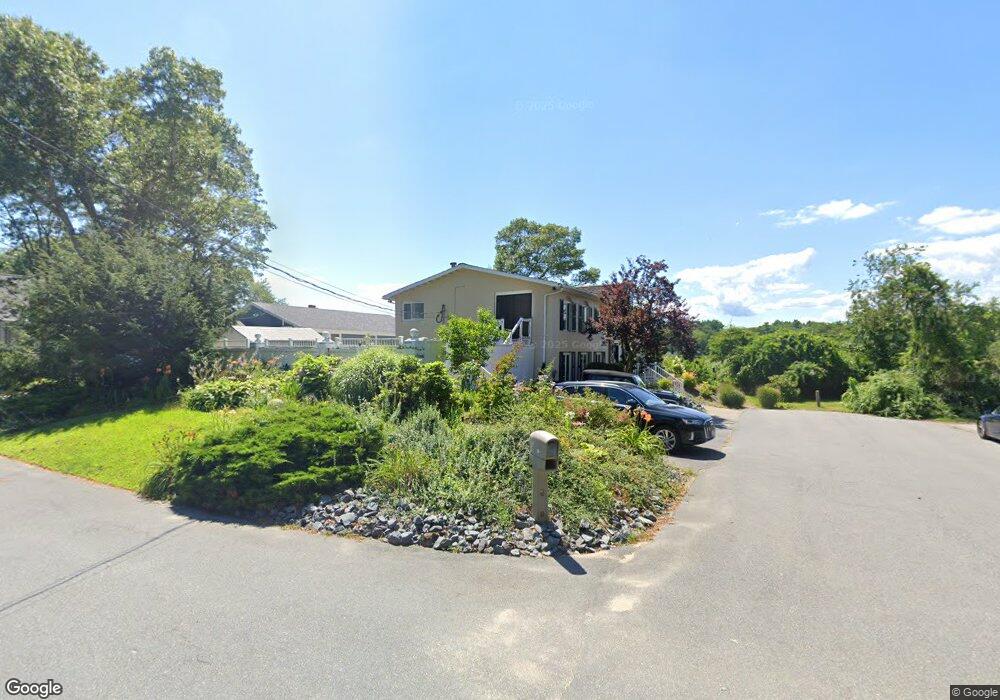
20 13th Ave Wareham, MA 02571
Weweantic NeighborhoodEstimated Value: $560,000 - $936,000
5
Beds
3
Baths
1,653
Sq Ft
$436/Sq Ft
Est. Value
About This Home
This home is located at 20 13th Ave, Wareham, MA 02571 and is currently estimated at $721,220, approximately $436 per square foot. 20 13th Ave is a home located in Plymouth County with nearby schools including Tabor Academy.
Ownership History
Date
Name
Owned For
Owner Type
Purchase Details
Closed on
Sep 28, 2018
Sold by
Smith Christopher B
Bought by
Larson Troy E and Steadman Timothy Y
Current Estimated Value
Home Financials for this Owner
Home Financials are based on the most recent Mortgage that was taken out on this home.
Original Mortgage
$260,000
Outstanding Balance
$224,856
Interest Rate
4.5%
Mortgage Type
New Conventional
Estimated Equity
$496,364
Purchase Details
Closed on
Sep 17, 2007
Sold by
Baker Douglas A and Riley Thomas F
Bought by
Smith Christopher B
Purchase Details
Closed on
Sep 25, 1998
Sold by
Mann Chester S
Bought by
Lesley Willie J
Purchase Details
Closed on
Jan 24, 1997
Sold by
Parrish Robert H
Bought by
Mann Chester S
Purchase Details
Closed on
Dec 27, 1990
Sold by
Rockland Fed Cr Un
Bought by
Baker Douglas A
Purchase Details
Closed on
Jul 31, 1990
Sold by
Edison Jan-Lori
Bought by
Rockland Fed Cu
Create a Home Valuation Report for This Property
The Home Valuation Report is an in-depth analysis detailing your home's value as well as a comparison with similar homes in the area
Home Values in the Area
Average Home Value in this Area
Purchase History
| Date | Buyer | Sale Price | Title Company |
|---|---|---|---|
| Larson Troy E | $460,000 | -- | |
| Larson Troy E | $460,000 | -- | |
| Smith Christopher B | $403,920 | -- | |
| Lesley Willie J | $49,000 | -- | |
| Mann Chester S | $40,000 | -- | |
| Mann Chester S | $40,000 | -- | |
| Baker Douglas A | $135,000 | -- | |
| Baker Douglas A | $135,000 | -- | |
| Rockland Fed Cu | $120,000 | -- | |
| Rockland Fed Cu | $120,000 | -- | |
| Larson Troy E | $460,000 | -- | |
| Smith Christopher B | $403,920 | -- | |
| Lesley Willie J | $49,000 | -- |
Source: Public Records
Mortgage History
| Date | Status | Borrower | Loan Amount |
|---|---|---|---|
| Open | Larson Troy E | $260,000 | |
| Closed | Larson Troy E | $260,000 |
Source: Public Records
Tax History
| Year | Tax Paid | Tax Assessment Tax Assessment Total Assessment is a certain percentage of the fair market value that is determined by local assessors to be the total taxable value of land and additions on the property. | Land | Improvement |
|---|---|---|---|---|
| 2025 | $7,585 | $727,900 | $200,800 | $527,100 |
| 2024 | $7,240 | $644,700 | $140,000 | $504,700 |
| 2023 | $6,976 | $579,900 | $127,300 | $452,600 |
| 2022 | $6,685 | $507,200 | $127,300 | $379,900 |
| 2021 | $6,487 | $482,300 | $127,300 | $355,000 |
| 2020 | $6,395 | $482,300 | $127,300 | $355,000 |
| 2019 | $5,265 | $396,200 | $117,400 | $278,800 |
| 2018 | $4,862 | $356,700 | $117,400 | $239,300 |
| 2017 | $4,420 | $328,600 | $117,400 | $211,200 |
| 2016 | $4,635 | $342,600 | $145,400 | $197,200 |
| 2015 | $4,049 | $309,800 | $145,400 | $164,400 |
| 2014 | $4,044 | $314,700 | $122,900 | $191,800 |
Source: Public Records
Map
Nearby Homes
- 15 14th Ave
- 9 Woodville Way
- 233 Marion Rd
- 14 Briarwood Dr
- 6 Bourne Terrace
- 12 Taft St
- 10 Longmeadow Dr
- 4 Roosevelt St
- 58 Shady Ln
- 19 Station St
- 0 Cromesett Rd (Off) Unit 73385395
- 17 Station St
- 6 Wildwood Ave
- 21 Bayview St
- 7 Maud Palmer Dr
- 20 Grant St
- 15 Broadmarsh Ave
- 43 Shore Ave
- 10 Barnes St
- 6 Allen Ave
Your Personal Tour Guide
Ask me questions while you tour the home.