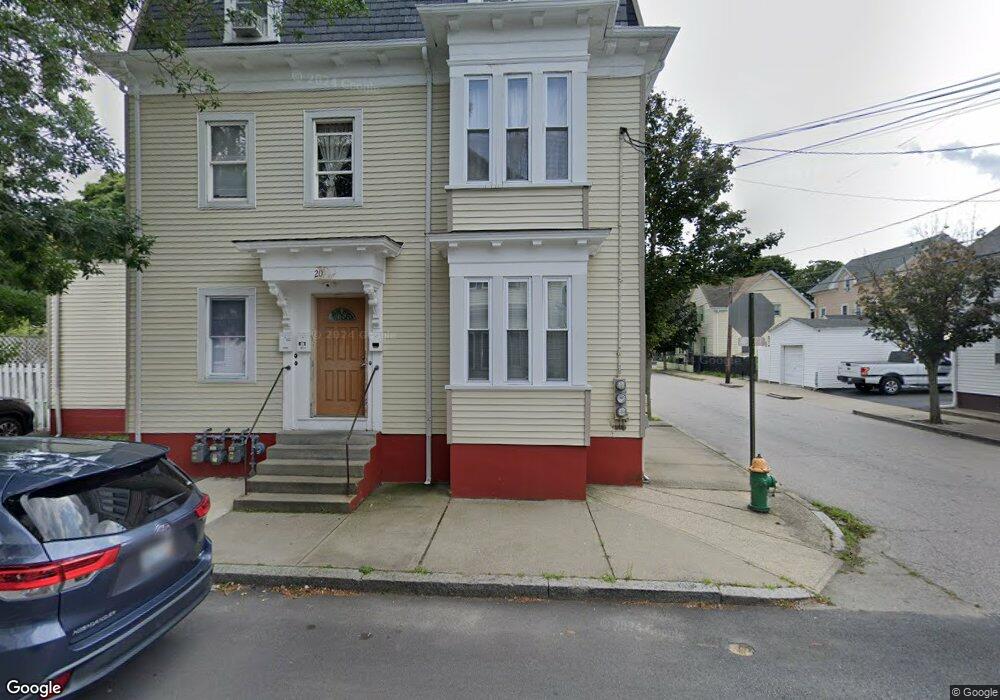
20 Bain St Cranston, RI 02920
Arlington NeighborhoodEstimated Value: $494,000 - $693,000
6
Beds
3
Baths
3,462
Sq Ft
$177/Sq Ft
Est. Value
About This Home
This home is located at 20 Bain St, Cranston, RI 02920 and is currently estimated at $614,000, approximately $177 per square foot. 20 Bain St is a home located in Providence County with nearby schools including Hugh B. Bain Middle School, Cranston High School East, and Achievement First Iluminar Mayoral Academy.
Ownership History
Date
Name
Owned For
Owner Type
Purchase Details
Closed on
May 27, 2003
Sold by
Southworth Mark
Bought by
Sandoval Juan
Current Estimated Value
Purchase Details
Closed on
May 30, 2001
Sold by
Point View Prop Inc
Bought by
Southworth Mark
Purchase Details
Closed on
Mar 31, 1992
Sold by
Smith Walterr W
Bought by
Pustay Christine H
Create a Home Valuation Report for This Property
The Home Valuation Report is an in-depth analysis detailing your home's value as well as a comparison with similar homes in the area
Home Values in the Area
Average Home Value in this Area
Purchase History
| Date | Buyer | Sale Price | Title Company |
|---|---|---|---|
| Sandoval Juan | $215,000 | -- | |
| Southworth Mark | $169,000 | -- | |
| Pustay Christine H | $121,500 | -- |
Source: Public Records
Mortgage History
| Date | Status | Borrower | Loan Amount |
|---|---|---|---|
| Open | Pustay Christine H | $50,000 | |
| Open | Pustay Christine H | $156,000 | |
| Closed | Pustay Christine H | $199,000 |
Source: Public Records
Tax History
| Year | Tax Paid | Tax Assessment Tax Assessment Total Assessment is a certain percentage of the fair market value that is determined by local assessors to be the total taxable value of land and additions on the property. | Land | Improvement |
|---|---|---|---|---|
| 2025 | $7,930 | $571,300 | $101,300 | $470,000 |
| 2024 | $7,775 | $571,300 | $101,300 | $470,000 |
| 2023 | $5,834 | $308,700 | $44,500 | $264,200 |
| 2022 | $5,714 | $308,700 | $44,500 | $264,200 |
| 2021 | $5,557 | $308,700 | $44,500 | $264,200 |
| 2020 | $4,968 | $239,200 | $34,900 | $204,300 |
| 2019 | $4,968 | $239,200 | $34,900 | $204,300 |
| 2018 | $4,853 | $239,200 | $34,900 | $204,300 |
| 2017 | $4,166 | $181,600 | $15,900 | $165,700 |
| 2016 | $4,077 | $181,600 | $15,900 | $165,700 |
| 2015 | $4,077 | $181,600 | $15,900 | $165,700 |
| 2014 | $3,451 | $151,100 | $15,900 | $135,200 |
Source: Public Records
Map
Nearby Homes
- 69 Whipple Ave
- 63 Lincoln Ave
- 95 Elwyn St
- 44 Puritan St
- 293 Webster Ave
- 30 Pomham St
- 51 Old Oak Ave
- 16 Winthrop St
- 19 Pavilion Ct
- 367 Laurel Hill Ave
- 0 Princess Ave
- 13 Halton St
- 74 Lake St Unit 76
- 355 Laurel Hill Ave
- 14 Shafter St
- 79 Priscilla Ave
- 10 Calhoun Ave
- 775 Potters Ave Unit 3
- 654 Cranston St
- 92 Old Oak Ave