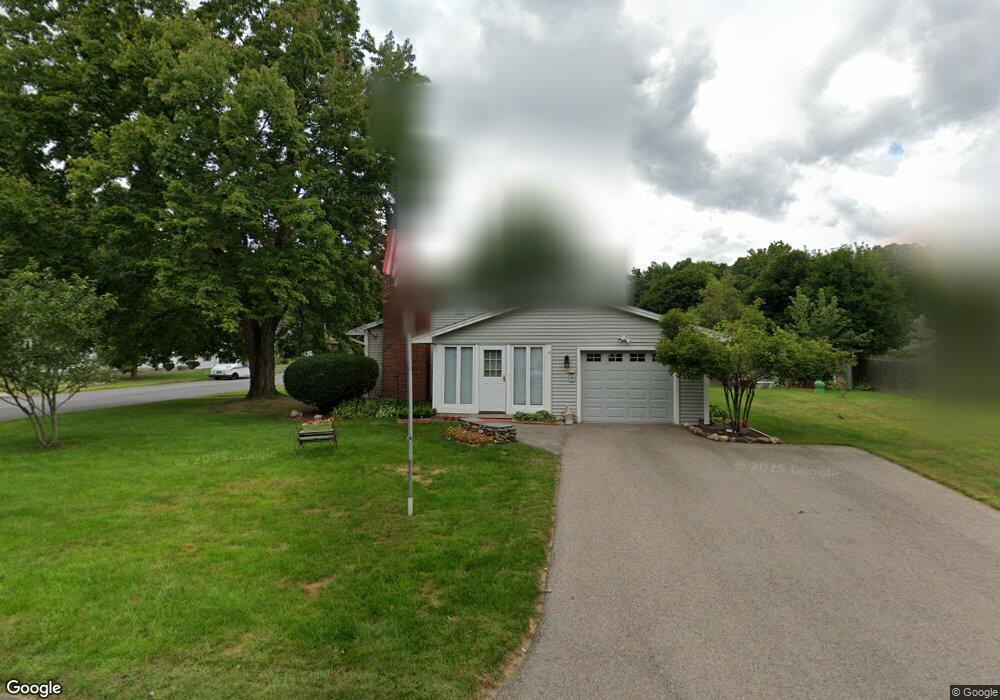
20 Bates Dr Nashua, NH 03064
North End Nashua NeighborhoodEstimated Value: $455,000 - $514,000
3
Beds
1
Bath
1,056
Sq Ft
$457/Sq Ft
Est. Value
About This Home
This home is located at 20 Bates Dr, Nashua, NH 03064 and is currently estimated at $482,559, approximately $456 per square foot. 20 Bates Dr is a home located in Hillsborough County with nearby schools including Charlotte Ave Elementary School, Pennichuck Middle School, and Nashua High School North.
Ownership History
Date
Name
Owned For
Owner Type
Purchase Details
Closed on
Sep 22, 2021
Sold by
Letendre Armand and Letendre Jeannette L
Bought by
Letendre
Current Estimated Value
Purchase Details
Closed on
May 17, 2010
Sold by
Venovich Nancy A
Bought by
Letendre Armand and Letendre Jeanette L
Purchase Details
Closed on
Aug 6, 2007
Sold by
Raymond Rose M
Bought by
Venovich Nancy A
Home Financials for this Owner
Home Financials are based on the most recent Mortgage that was taken out on this home.
Original Mortgage
$150,000
Interest Rate
6.73%
Mortgage Type
Purchase Money Mortgage
Purchase Details
Closed on
May 2, 2005
Sold by
M Bathalon Rev T M
Bought by
Raymond Rose M
Home Financials for this Owner
Home Financials are based on the most recent Mortgage that was taken out on this home.
Original Mortgage
$200,000
Interest Rate
5.95%
Mortgage Type
Purchase Money Mortgage
Create a Home Valuation Report for This Property
The Home Valuation Report is an in-depth analysis detailing your home's value as well as a comparison with similar homes in the area
Home Values in the Area
Average Home Value in this Area
Purchase History
| Date | Buyer | Sale Price | Title Company |
|---|---|---|---|
| Letendre | -- | None Available | |
| Letendre Armand | $232,500 | -- | |
| Venovich Nancy A | $250,000 | -- | |
| Raymond Rose M | $264,000 | -- |
Source: Public Records
Mortgage History
| Date | Status | Borrower | Loan Amount |
|---|---|---|---|
| Previous Owner | Raymond Rose M | $150,000 | |
| Previous Owner | Raymond Rose M | $200,000 |
Source: Public Records
Tax History Compared to Growth
Tax History
| Year | Tax Paid | Tax Assessment Tax Assessment Total Assessment is a certain percentage of the fair market value that is determined by local assessors to be the total taxable value of land and additions on the property. | Land | Improvement |
|---|---|---|---|---|
| 2024 | $7,090 | $445,900 | $161,300 | $284,600 |
| 2023 | $6,751 | $370,300 | $129,100 | $241,200 |
| 2022 | $6,691 | $370,300 | $129,100 | $241,200 |
| 2021 | $5,965 | $256,900 | $86,100 | $170,800 |
| 2020 | $5,770 | $255,200 | $86,100 | $169,100 |
| 2019 | $5,553 | $255,200 | $86,100 | $169,100 |
| 2018 | $5,413 | $255,200 | $86,100 | $169,100 |
| 2017 | $4,776 | $185,200 | $67,000 | $118,200 |
| 2016 | $4,643 | $185,200 | $67,000 | $118,200 |
| 2015 | $4,543 | $185,200 | $67,000 | $118,200 |
| 2014 | $4,454 | $185,200 | $67,000 | $118,200 |
Source: Public Records
Map
Nearby Homes
- 113 Concord St
- 73 Berkeley St
- 16 Cassandra Ln
- 19 Bartlett Ave
- 11 Juliana Ave Unit 52
- 1 Shoreline Dr Unit 16
- 12 Juliana Ave Unit 14
- 21 Edson St
- 3 Opal Way Unit 3
- 1 Opal Way Unit 1
- 2 Opal Way Unit 2
- 12 Bell St Unit 100103
- 31 Juliana Ave
- 31 Juliana Ave Unit 4
- 9 Elystan Cir
- 7 Shoreline Dr Unit 13
- 12 Leclair Dr
- 5 Shoreline Dr Unit 14
- 9 Doveton Ln Unit B
- 71 Concord St