K
Seller's Agent in 2025
Kimberly Pirog
Laplante and Company LLC
1 in this area
3 Total Sales
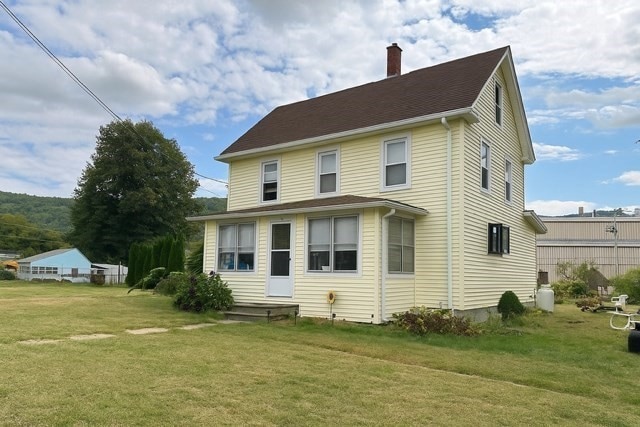


AN OLDIE BUT A GOODY!! Beautiful cozy colonial is ready for it's new owner, is that you? Put your rockers in the 3 season porch. Kitchen offers plenty of cabinet & counter space, tile flooring, functional appliances (propane gas stove), & dining area. Beautiful tiled bathroom w/ huge jacuzzi bathtub plus washer and dryer hookup. Living room provides all the comforts; impressive hardwood floor w/ partial tile suggesting dining/ office area, ceiling fan, & French doors leading outside to a private deck to throw your BBQ on. Propane piping for ALL YEAR round grill station hook-up (Located on the deck). 2nd fl offers oversize main bedroom w/ 4x12 walk in closet. 2nd & 3rd bd are tandem. Potential piping exists for future bathroom install. Need more space? Walk up attic can provide that. 3 CAR GARAGE for that car enthusiast. No need for a lift. Garage provides stairs that allows you to work underneath the car. Because cozy isn't just a vibe---It's a lifestyle. COME CHECK IT OUT!
| Date | Type | Sale Price | Title Company |
|---|---|---|---|
| Quit Claim Deed | $280,000 | -- | |
| Quit Claim Deed | $126,000 | -- | |
| Deed | -- | -- | |
| Deed | -- | -- | |
| Deed | -- | -- | |
| Deed | -- | -- |
| Date | Status | Loan Amount | Loan Type |
|---|---|---|---|
| Open | $274,928 | Purchase Money Mortgage | |
| Previous Owner | $123,717 | FHA |
| Date | Event | Price | List to Sale | Price per Sq Ft |
|---|---|---|---|---|
| 10/30/2025 10/30/25 | Sold | $280,000 | -1.8% | $228 / Sq Ft |
| 09/30/2025 09/30/25 | Pending | -- | -- | -- |
| 09/26/2025 09/26/25 | For Sale | $285,000 | -- | $232 / Sq Ft |
| Year | Tax Paid | Tax Assessment Tax Assessment Total Assessment is a certain percentage of the fair market value that is determined by local assessors to be the total taxable value of land and additions on the property. | Land | Improvement |
|---|---|---|---|---|
| 2025 | $3,224 | $214,100 | $26,700 | $187,400 |
| 2024 | $3,075 | $188,300 | $25,200 | $163,100 |
| 2023 | $3,029 | $175,500 | $23,700 | $151,800 |
| 2022 | $2,860 | $147,900 | $22,000 | $125,900 |
| 2021 | $2,779 | $137,700 | $22,000 | $115,700 |
| 2020 | $2,641 | $128,000 | $22,000 | $106,000 |
| 2019 | $2,587 | $128,000 | $22,000 | $106,000 |
| 2018 | $2,293 | $110,700 | $19,200 | $91,500 |
| 2017 | $2,322 | $111,800 | $22,000 | $89,800 |
| 2016 | $2,259 | $111,800 | $22,000 | $89,800 |
| 2015 | $2,197 | $111,800 | $22,000 | $89,800 |
| 2014 | $2,122 | $115,900 | $22,200 | $93,700 |
K
Seller's Agent in 2025
Kimberly Pirog
Laplante and Company LLC
1 in this area
3 Total Sales

Buyer's Agent in 2025
Sara Enman
Naples Realty Group
(413) 650-1314
1 in this area
3 Total Sales
Source: MLS Property Information Network (MLS PIN)
MLS Number: 73436222
APN: WARE-000053-000000-000053
Disclaimer: Certain information contained herein is derived from information provided by parties other than Homes.com. All information provided is deemed reliable, but is not guaranteed to be accurate and should be independently verified.
![]() The property listing data and information, or the Images, set forth herein were provided to MLS Property Information Network, Inc. from third party sources, including sellers, lessors and public records, and were compiled by MLS Property Information Network, Inc. The property listing data and information, and the Images, are for the personal, non-commercial use of consumers having a good faith interest in purchasing or leasing listed properties of the type displayed to them and may not be used for any purpose other than to identify prospective properties which such consumers may have a good faith interest in purchasing or leasing. MLS Property Information Network, Inc. and its subscribers disclaim any and all representations and warranties as to the accuracy of the property listing data and information, or as to the accuracy of any of the Images, set forth herein.
The property listing data and information, or the Images, set forth herein were provided to MLS Property Information Network, Inc. from third party sources, including sellers, lessors and public records, and were compiled by MLS Property Information Network, Inc. The property listing data and information, and the Images, are for the personal, non-commercial use of consumers having a good faith interest in purchasing or leasing listed properties of the type displayed to them and may not be used for any purpose other than to identify prospective properties which such consumers may have a good faith interest in purchasing or leasing. MLS Property Information Network, Inc. and its subscribers disclaim any and all representations and warranties as to the accuracy of the property listing data and information, or as to the accuracy of any of the Images, set forth herein.
Ask me questions while you tour the home.